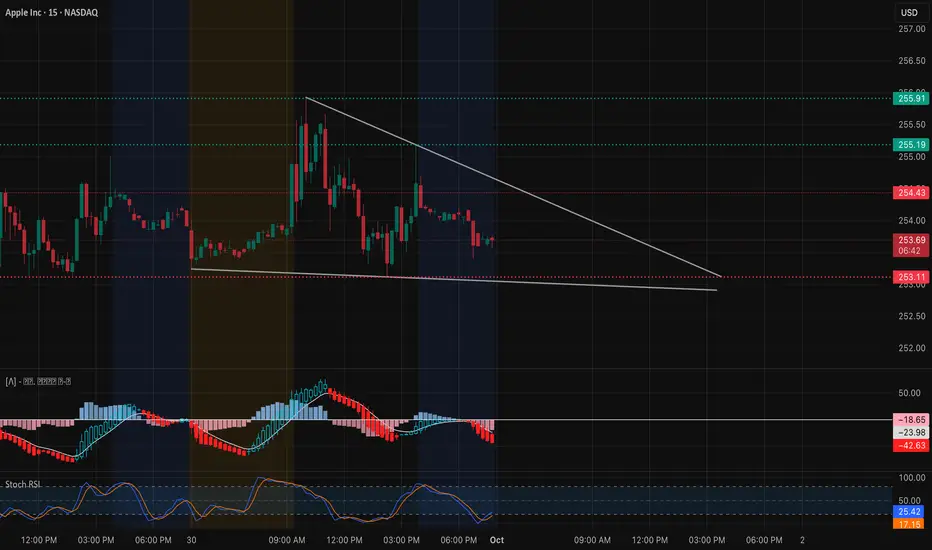
Intraday View (15-Min Chart)
AAPL traded choppy with a clear descending trendline pressing price lower. It’s holding around $253–$254, but momentum is fading as MACD stays red and Stoch RSI remains weak.
* Support Levels: $253.11, $253.58, $254.43
* Resistance Levels: $255.19, $255.91
* Indicators: MACD firmly negative, showing sellers still in control. Stoch RSI hovering near lows, suggesting potential for a small bounce.
📌 Intraday Thought (Oct. 1): If $253 holds, AAPL could bounce back to $255+. A breakdown under $253 risks a slide toward $250. Scalpers can lean long on $253 support with tight stops, or fade into $255.9 resistance if price rejects.
Options & Swing View (1H + GEX)

Gamma exposure provides a wide setup:
* Upside: Heavy call walls at $257–$262.5, with a gamma cluster stretching toward $265–$270.
* Downside: Put support around $247.5–$242.5, deeper wall at $237.5.
This keeps AAPL boxed between $250–$257 in the short term. A break over $257 could trigger a push into $262–$265, while losing $250 risks deeper tests toward $247.
* Bullish Play (Oct. 1): Calls targeting $262.5–$265 if $257 breaks on volume.
* Bearish Hedge: Short puts toward $250 → $247.5 if support fails.
* Neutral Play: Iron condor between $247.5–$257 while AAPL consolidates.
My Thoughts (Oct. 1)
AAPL is stuck under a descending trendline, and momentum looks weak into the close. The $253 level is key—hold it and we could see a bounce back to $255+, but a break lower risks sliding toward $250. For options, I’d wait for a confirmed move through $257 breakout or $250 breakdown before sizing up.
Disclaimer: This analysis is for educational purposes only and does not constitute financial advice. Always do your own research and manage risk before trading.
AAPL traded choppy with a clear descending trendline pressing price lower. It’s holding around $253–$254, but momentum is fading as MACD stays red and Stoch RSI remains weak.
* Support Levels: $253.11, $253.58, $254.43
* Resistance Levels: $255.19, $255.91
* Indicators: MACD firmly negative, showing sellers still in control. Stoch RSI hovering near lows, suggesting potential for a small bounce.
📌 Intraday Thought (Oct. 1): If $253 holds, AAPL could bounce back to $255+. A breakdown under $253 risks a slide toward $250. Scalpers can lean long on $253 support with tight stops, or fade into $255.9 resistance if price rejects.
Options & Swing View (1H + GEX)
Gamma exposure provides a wide setup:
* Upside: Heavy call walls at $257–$262.5, with a gamma cluster stretching toward $265–$270.
* Downside: Put support around $247.5–$242.5, deeper wall at $237.5.
This keeps AAPL boxed between $250–$257 in the short term. A break over $257 could trigger a push into $262–$265, while losing $250 risks deeper tests toward $247.
* Bullish Play (Oct. 1): Calls targeting $262.5–$265 if $257 breaks on volume.
* Bearish Hedge: Short puts toward $250 → $247.5 if support fails.
* Neutral Play: Iron condor between $247.5–$257 while AAPL consolidates.
My Thoughts (Oct. 1)
AAPL is stuck under a descending trendline, and momentum looks weak into the close. The $253 level is key—hold it and we could see a bounce back to $255+, but a break lower risks sliding toward $250. For options, I’d wait for a confirmed move through $257 breakout or $250 breakdown before sizing up.
Disclaimer: This analysis is for educational purposes only and does not constitute financial advice. Always do your own research and manage risk before trading.
免責事項
これらの情報および投稿は、TradingViewが提供または保証する金融、投資、取引、またはその他の種類のアドバイスや推奨を意図したものではなく、またそのようなものでもありません。詳しくは利用規約をご覧ください。
免責事項
これらの情報および投稿は、TradingViewが提供または保証する金融、投資、取引、またはその他の種類のアドバイスや推奨を意図したものではなく、またそのようなものでもありません。詳しくは利用規約をご覧ください。