Aarti Industries – Weekly Chart Update
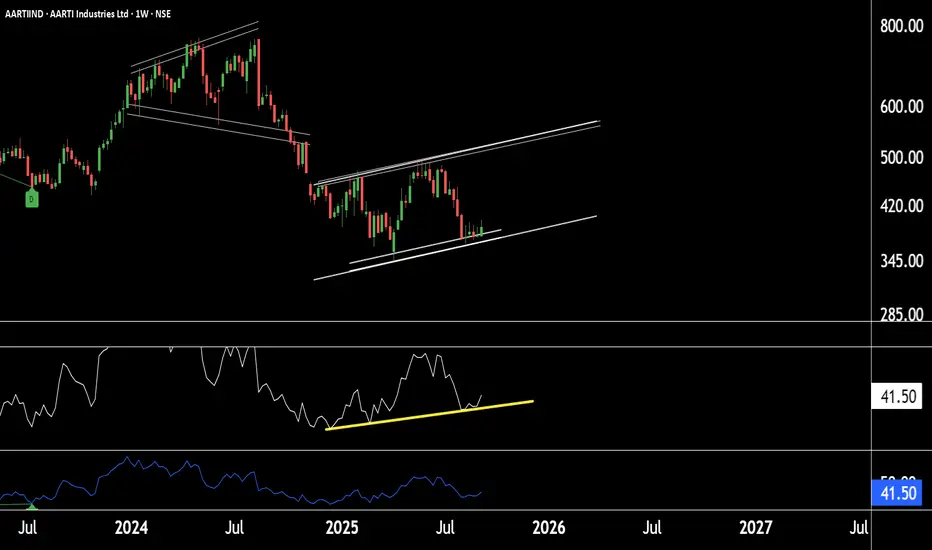
Chart Pattern: Stock is trading within a shorter-timeframe parallel channel.
Support Zone: Strong support observed near ₹370 – ₹380 levels.
RSI Indicator: RSI is also taking support and moving upward, indicating positive momentum.
Trend Outlook: If this support zone sustains, the stock is likely to move into an uptrend.
Price Projection: Potential for higher levels at 500-521 in Aarti Industries.
Thank you!
@RahulSaraoge
Connect us at t.me/stridesadvisory
Connect us at t.me/stridesadvisory
免責事項
これらの情報および投稿は、TradingViewが提供または保証する金融、投資、取引、またはその他の種類のアドバイスや推奨を意図したものではなく、またそのようなものでもありません。詳しくは利用規約をご覧ください。
@RahulSaraoge
Connect us at t.me/stridesadvisory
Connect us at t.me/stridesadvisory
免責事項
これらの情報および投稿は、TradingViewが提供または保証する金融、投資、取引、またはその他の種類のアドバイスや推奨を意図したものではなく、またそのようなものでもありません。詳しくは利用規約をご覧ください。