ADA / BTC
🌟 Techincal Analysis🌟
Hi guys
Ada recently started to pump hard again
Looking at weekly chart you can see :
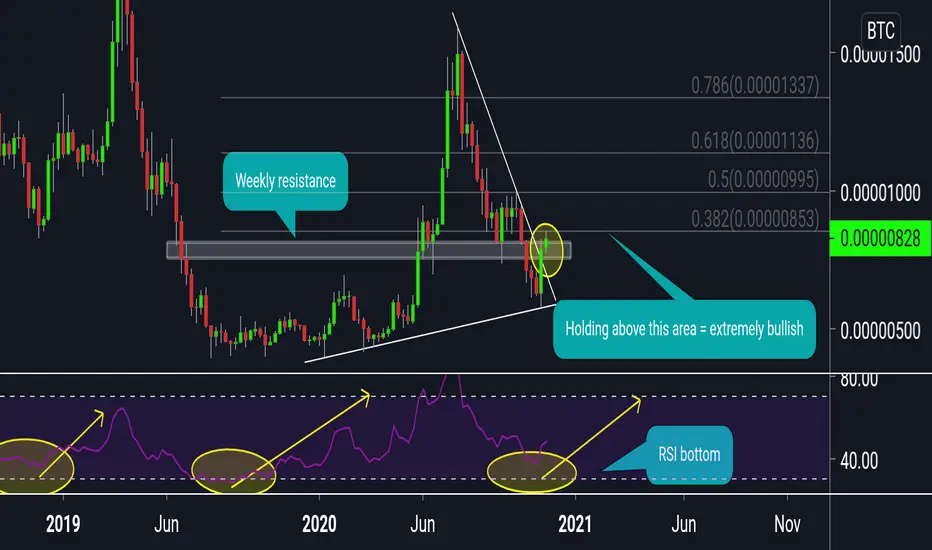
1- It just broke strong horizontal resistance
2- Broke trendline resistance
3-On bottom of RSI its show bullish reversal signs
4-Great volume entered last few days
5-btc dominance start to decrease (alt season)
All this are bullish signs
Now ada Got rejected from 855 sat (0.382fib)
If ada managed to hold above this fib resistance
We can see next targets in Fibonacci
995 sat
1136 sat
1337 sat
Good luck and happy trading 🌹
🌟 Techincal Analysis🌟
Hi guys
Ada recently started to pump hard again
Looking at weekly chart you can see :
1- It just broke strong horizontal resistance
2- Broke trendline resistance
3-On bottom of RSI its show bullish reversal signs
4-Great volume entered last few days
5-btc dominance start to decrease (alt season)
All this are bullish signs
Now ada Got rejected from 855 sat (0.382fib)
If ada managed to hold above this fib resistance
We can see next targets in Fibonacci
995 sat
1136 sat
1337 sat
Good luck and happy trading 🌹
ノート
Hope you are in profit after analysis now 🔥🔥🔥ノート
update previous ideaAda / btc
853 sat ✅
995 sat ✅
The price got rejected exactly at 995 (0.5fib)
You see the accuracy of my lines 😄
📈Telegram channel: t.me/bitcoin_masters
💎For Premium Signals Group ask me here: t.me/Babenski
💎For Premium Signals Group ask me here: t.me/Babenski
免責事項
この情報および投稿は、TradingViewが提供または推奨する金融、投資、トレード、その他のアドバイスや推奨を意図するものではなく、それらを構成するものでもありません。詳細は利用規約をご覧ください。
📈Telegram channel: t.me/bitcoin_masters
💎For Premium Signals Group ask me here: t.me/Babenski
💎For Premium Signals Group ask me here: t.me/Babenski
免責事項
この情報および投稿は、TradingViewが提供または推奨する金融、投資、トレード、その他のアドバイスや推奨を意図するものではなく、それらを構成するものでもありません。詳細は利用規約をご覧ください。