🚀 **ADA/USDT Weekly Analysis – Ready for Takeoff?** 📈
🔹 **📊 Long-Term Uptrend in Play**
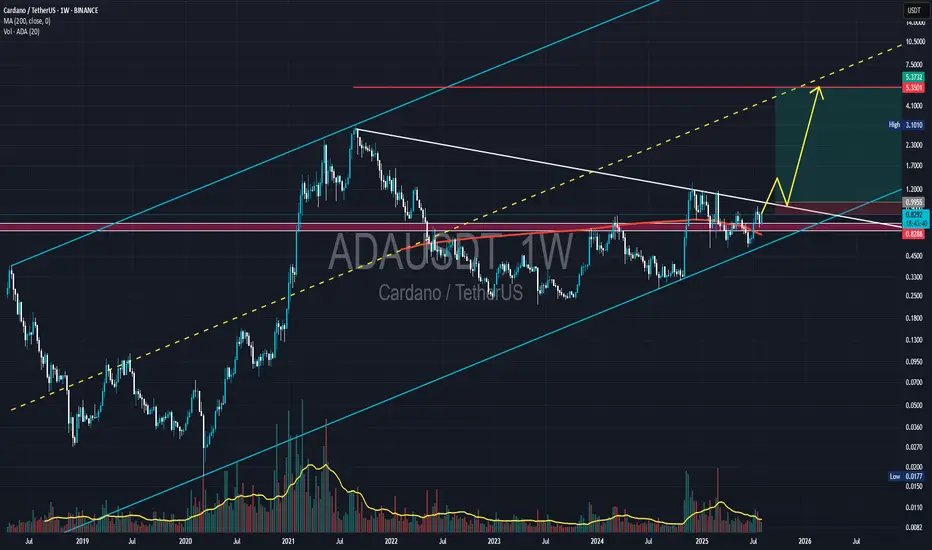
Cardano (ADA) has been respecting a long-term ascending channel since 2018. The structure suggests steady bullish momentum over the years.
🔹 **🔐 Key Levels to Watch**
- 🛡️ **Support:** $0.8288
- 🧱 **Resistance (ATH):** $3.1010
These levels are crucial. A breakout above resistance could ignite a powerful rally.
🔹 **⚔️ Trendline Battle Zone**
Price is approaching a key confluence:
- 🔻 Descending white trendline
- 🔺 Ascending yellow trendline
This intersection could act as a launchpad for the next move.
🔹 **📏 200-Week MA Reclaimed**
ADA is trading above the 200-week moving average (**$0.6159**), a bullish sign indicating strength and potential continuation.
🔹 **📊 Volume Surge**
Recent volume spikes above the average (yellow line) show growing interest and accumulation. Smart money might be positioning early.
🔹 **📈 Bullish Scenario**
If ADA holds above $0.8288, the path toward the all-time high at $3.1010 becomes technically viable.
🟡 The yellow arrow on the chart outlines this potential move.
---
📌 **Summary:**
ADA is at a technical crossroads. A breakout above the confluence zone and sustained strength above the 200-week MA could lead to a medium- to long-term bullish rally.
👀 Watch volume and price action closely around $0.8288.
📍 *This post is for educational purposes only – not financial advice.*
🔹 **📊 Long-Term Uptrend in Play**
Cardano (ADA) has been respecting a long-term ascending channel since 2018. The structure suggests steady bullish momentum over the years.
🔹 **🔐 Key Levels to Watch**
- 🛡️ **Support:** $0.8288
- 🧱 **Resistance (ATH):** $3.1010
These levels are crucial. A breakout above resistance could ignite a powerful rally.
🔹 **⚔️ Trendline Battle Zone**
Price is approaching a key confluence:
- 🔻 Descending white trendline
- 🔺 Ascending yellow trendline
This intersection could act as a launchpad for the next move.
🔹 **📏 200-Week MA Reclaimed**
ADA is trading above the 200-week moving average (**$0.6159**), a bullish sign indicating strength and potential continuation.
🔹 **📊 Volume Surge**
Recent volume spikes above the average (yellow line) show growing interest and accumulation. Smart money might be positioning early.
🔹 **📈 Bullish Scenario**
If ADA holds above $0.8288, the path toward the all-time high at $3.1010 becomes technically viable.
🟡 The yellow arrow on the chart outlines this potential move.
---
📌 **Summary:**
ADA is at a technical crossroads. A breakout above the confluence zone and sustained strength above the 200-week MA could lead to a medium- to long-term bullish rally.
👀 Watch volume and price action closely around $0.8288.
📍 *This post is for educational purposes only – not financial advice.*
免責事項
これらの情報および投稿は、TradingViewが提供または保証する金融、投資、取引、またはその他の種類のアドバイスや推奨を意図したものではなく、またそのようなものでもありません。詳しくは利用規約をご覧ください。
免責事項
これらの情報および投稿は、TradingViewが提供または保証する金融、投資、取引、またはその他の種類のアドバイスや推奨を意図したものではなく、またそのようなものでもありません。詳しくは利用規約をご覧ください。