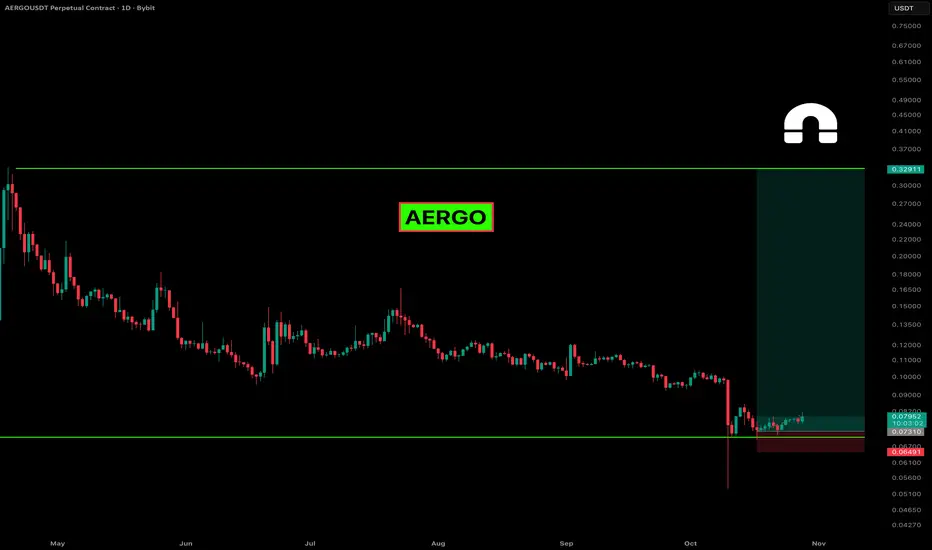
AERGO has been drifting lower for months, but price action seems to be stabilizing near a solid historical support zone around the $0.06–$0.07 range. After a sharp selloff earlier in October, the chart now shows early signs of accumulation — a small series of higher lows and tightening candles right above support. That’s usually where stronger hands start positioning before any larger move develops.
The weekly performance flipped slightly green (+3.5%), suggesting that selling pressure might finally be easing. On the daily chart, volume has picked up slightly, and the structure looks like it’s setting up for a potential relief rally if buyers can maintain momentum above this zone.
There’s plenty of room toward the upper range near $0.32 if a mid-term reversal plays out, but bulls still need confirmation through a clean breakout of the short-term consolidation.
Not financial advice, just watching how price reacts around this base. If it holds, it could turn into a solid recovery setup after months of decline.
Let’s see if buyers can defend this level and push AERGO into its next phase.
🚀🚀🚀AND DONT FORGET TO CHECK OUT MY PROFILE!
👉👉👉 I am using indicators from Risological.com
✅ Works on all markets
✅ 30-Day Money-Back Guarantee.
👉👉👉 CHECK IT OUT @ Risological.com
✅ Works on all markets
✅ 30-Day Money-Back Guarantee.
👉👉👉 CHECK IT OUT @ Risological.com
関連の投稿
免責事項
この情報および投稿は、TradingViewが提供または推奨する金融、投資、トレード、その他のアドバイスや推奨を意図するものではなく、それらを構成するものでもありません。詳細は利用規約をご覧ください。