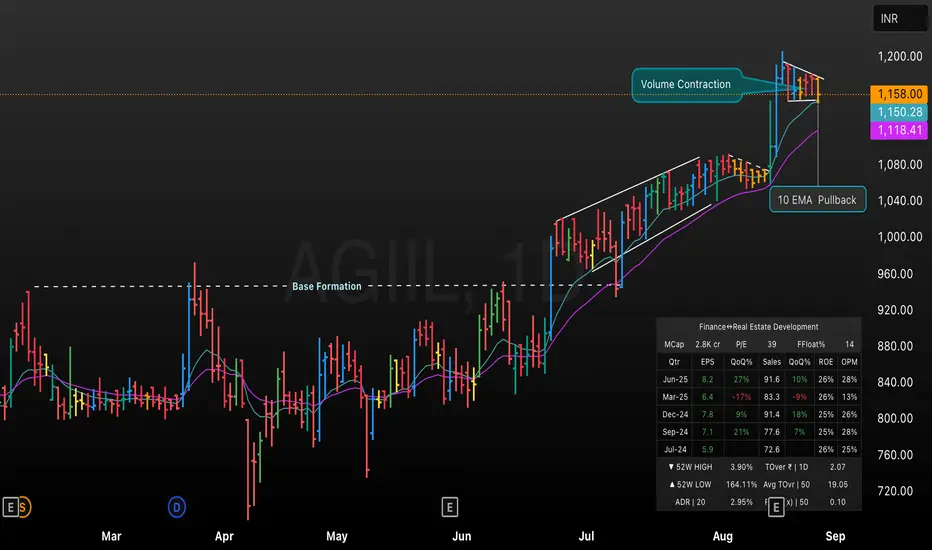
This TradingView chart showcases AGIIL’s technical progression from a prolonged base formation to a strong breakout phase, supported by notable volume contraction and a textbook 10 EMA pullback. Key chart highlights include identification of base formation, a rising price channel, and consolidation with EMA support. The volume contraction and recent price pullback to the 10 EMA reflect a healthy setup typically seen before sustained upward movement, making AGIIL a candidate for breakout trade strategies. Core metrics such as market cap, EPS growth, 52-week range, and liquidity are also visually summarized for quick reference.
免責事項
これらの情報および投稿は、TradingViewが提供または保証する金融、投資、取引、またはその他の種類のアドバイスや推奨を意図したものではなく、またそのようなものでもありません。詳しくは利用規約をご覧ください。
免責事項
これらの情報および投稿は、TradingViewが提供または保証する金融、投資、取引、またはその他の種類のアドバイスや推奨を意図したものではなく、またそのようなものでもありません。詳しくは利用規約をご覧ください。