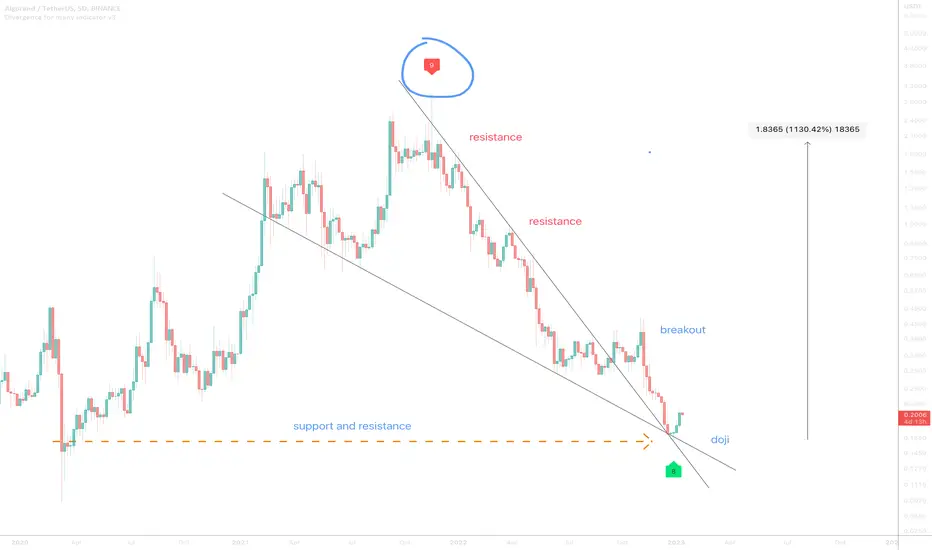
On the above 5-day chart price action has corrected over 90% since the beautiful sell signal (not shown) on September 2021 @ $2.40. Now is an excellent long moment. Why?
1) A strong buy signal (not shown).
2) Price action is printing as support on past resistance, look left.
3) Regular bullish divergence. Lots of it. Do not ignore.
4) Dragonfly DOJI candle.
Is it possible price action falls further? Sure.
Is it probable? No.
Ww
Type: trade
Risk: <=6% of portfolio
Timeframe: Don’t know.
Return: 10x
免責事項
これらの情報および投稿は、TradingViewが提供または保証する金融、投資、取引、またはその他の種類のアドバイスや推奨を意図したものではなく、またそのようなものでもありません。詳しくは利用規約をご覧ください。
免責事項
これらの情報および投稿は、TradingViewが提供または保証する金融、投資、取引、またはその他の種類のアドバイスや推奨を意図したものではなく、またそのようなものでもありません。詳しくは利用規約をご覧ください。