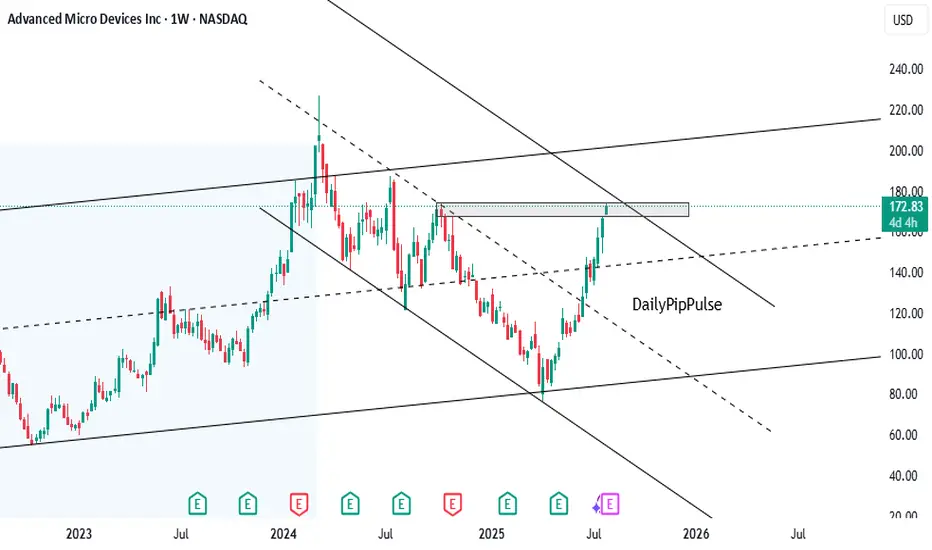
the weekly price action of Advanced Micro Devices Inc (AMD):The stock is trading near a critical resistance zone marked with a rectangular box just below $180.In the past, this area acted as a rejection point, evident from prior pullbacks when the stock neared these levels.
The chart reflects a larger declining channel. Current price action shows AMD approaching the upper boundary of this channel, which may act as dynamic resistance.
If AMD breaks above the $180 resistance convincingly, there’s potential for the stock to aim for higher targets, such as the next major zone ($240).
Failure to break above $180 may lead to a retest of lower levels, potentially near $140 or the breakout zone ($100-$120).
免責事項
この情報および投稿は、TradingViewが提供または推奨する金融、投資、トレード、その他のアドバイスや推奨を意図するものではなく、それらを構成するものでもありません。詳細は利用規約をご覧ください。
免責事項
この情報および投稿は、TradingViewが提供または推奨する金融、投資、トレード、その他のアドバイスや推奨を意図するものではなく、それらを構成するものでもありません。詳細は利用規約をご覧ください。