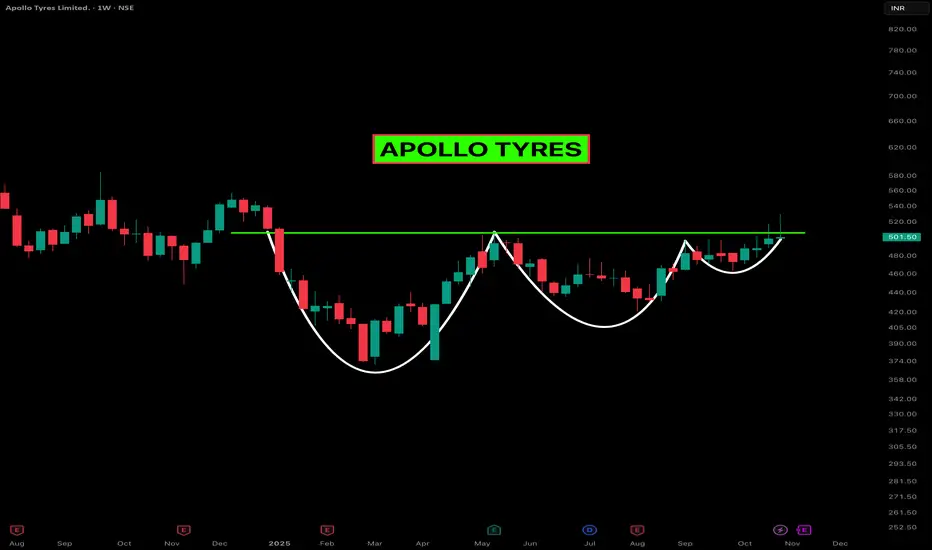
Apollo Tyres is showing some serious strength on the weekly chart. After months of squeezing inside a clean Volatility Contraction Pattern (VCP), the stock has finally started to break above the neckline zone around ₹500–₹520 — a level that’s acted as a ceiling multiple times in the past.
The structure is textbook — each pullback getting shallower, each base tighter, and now price pushing through resistance with conviction. That gradual reduction in volatility often signals institutional accumulation before a potential expansion move.
Momentum candles are widening, and while volume hasn’t exploded yet, it’s picking up — hinting that buyers are stepping in early. A retest toward the breakout zone wouldn’t be out of place, but as long as it holds above that ₹500 handle, the setup stays healthy.
Overall, it’s one of those quiet, technically strong setups that tend to move sharply once confirmed.
Let’s watch if bulls can keep control in the coming sessions — this chart definitely deserves to stay on the radar.
Check out my profile and follow me for more breakout setups like this one.
🟢 Want these signals on your chart? The Risological System predicted this move before it happened. Stop guessing tops and bottoms.
Get Lifetime Access (42% OFF Launch Offer):
[ 👉 Risological.com ]
Get Lifetime Access (42% OFF Launch Offer):
[ 👉 Risological.com ]
関連の投稿
免責事項
この情報および投稿は、TradingViewが提供または推奨する金融、投資、トレード、その他のアドバイスや推奨を意図するものではなく、それらを構成するものでもありません。詳細は利用規約をご覧ください。