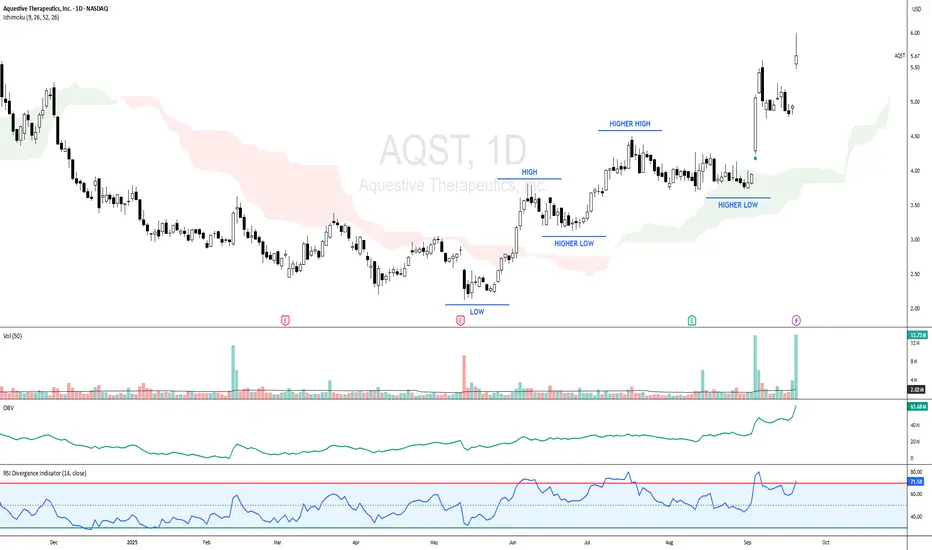
AQST - CURRENT PRICE : 5.67
Key Observations :
* Uptrend Structure – The chart shows a clear uptrend where both highs and lows are moving higher, confirming bullish price action.
* Volume Confirmation – Rising prices are supported by increasing trading volume, which validates the strength behind the uptrend.
* OBV Indicator – On-Balance Volume line is trending upward, confirming strong accumulation and participation from buyers.
* RSI Momentum – RSI is above 70, reflecting strong bullish momentum with no immediate signs of weakness.
Overall, the combination of higher highs & higher lows, volume confirmation, and bullish indicators (OBV & RSI) suggest that AQST (Aquestive Therapeutics, Inc.) is well-positioned for further upside in the short to medium term.
ENTRY PRICE : 5.47 - 5.67
FIRST TARGET : 6.40
SECOND TARGET : 7.90
SUPPORT : 4.97
トレード稼働中
Hit first target at 6.40 on 26 SEPTEMBER 2025.免責事項
The information and publications are not meant to be, and do not constitute, financial, investment, trading, or other types of advice or recommendations supplied or endorsed by TradingView. Read more in the Terms of Use.
免責事項
The information and publications are not meant to be, and do not constitute, financial, investment, trading, or other types of advice or recommendations supplied or endorsed by TradingView. Read more in the Terms of Use.