The stock of ASTEC has shown significant strength over the last two trading sessions, recording an impressive 30% gain accompanied by strong volume. This sharp upward movement is supported by multiple technical indicators, suggesting a shift in market sentiment.
The stock has managed to close above the 200-day EMA with substantial volume. Historically, such a breakout is considered a strong bullish signal, indicating potential trend reversal or continuation.
A bullish MACD crossover has occurred on the daily timeframe, with a positive histogram reinforcing upward momentum. This alignment of indicators often signals sustained buying interest.
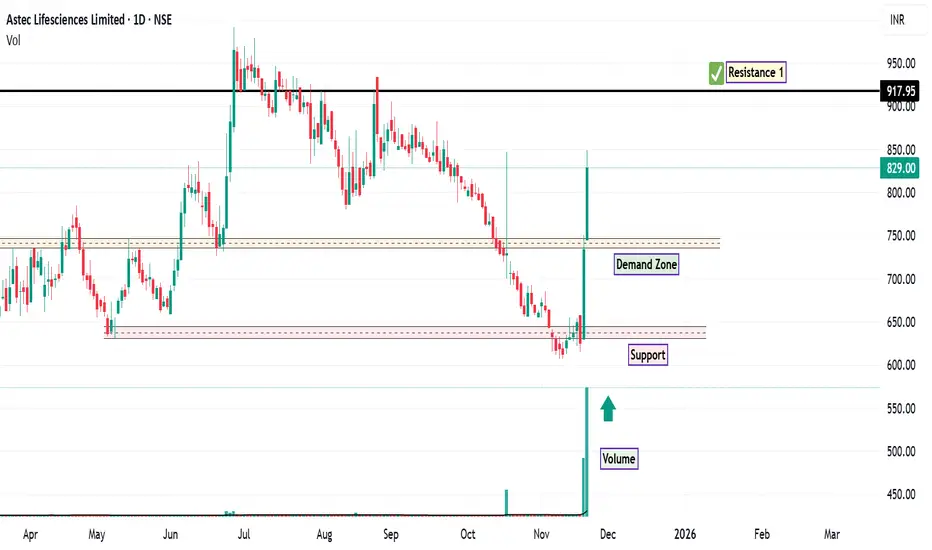
The RSI currently stands at 72, placing it in the overbought zone. This is notably above the 14-day average RSI of 62, suggesting that while momentum is strong, a short-term retracement could occur. Based on price structure, a retracement toward ₹745 may act as a demand zone, where buyers could re-enter if the stock consolidates.
Immediate Demand Zone: Around ₹745
Next Resistance: ₹917 (historical level based on prior price action)
Support Zone: Below the marked demand zone on the chart
Disclaimer: This analysis is intended for educational and informational purposes only. It does not constitute investment advice or a recommendation to buy, sell, or hold any financial instrument. Market participants should perform their own due diligence and consult with a licensed financial advisor before making any investment decisions.
The stock has managed to close above the 200-day EMA with substantial volume. Historically, such a breakout is considered a strong bullish signal, indicating potential trend reversal or continuation.
A bullish MACD crossover has occurred on the daily timeframe, with a positive histogram reinforcing upward momentum. This alignment of indicators often signals sustained buying interest.
The RSI currently stands at 72, placing it in the overbought zone. This is notably above the 14-day average RSI of 62, suggesting that while momentum is strong, a short-term retracement could occur. Based on price structure, a retracement toward ₹745 may act as a demand zone, where buyers could re-enter if the stock consolidates.
Immediate Demand Zone: Around ₹745
Next Resistance: ₹917 (historical level based on prior price action)
Support Zone: Below the marked demand zone on the chart
Disclaimer: This analysis is intended for educational and informational purposes only. It does not constitute investment advice or a recommendation to buy, sell, or hold any financial instrument. Market participants should perform their own due diligence and consult with a licensed financial advisor before making any investment decisions.
免責事項
この情報および投稿は、TradingViewが提供または推奨する金融、投資、トレード、その他のアドバイスや推奨を意図するものではなく、それらを構成するものでもありません。詳細は利用規約をご覧ください。
免責事項
この情報および投稿は、TradingViewが提供または推奨する金融、投資、トレード、その他のアドバイスや推奨を意図するものではなく、それらを構成するものでもありません。詳細は利用規約をご覧ください。