Key Technical Indicators:
Moving Averages: The stock is trading above its 200-day exponential moving average (EMA), indicating a long-term uptrend.
Stochastic RSI: The stochastic RSI is in the overbought zone, suggesting potential for a short-term pullback.
MACD: The Moving Average Convergence Divergence (MACD) is above the signal line, supporting the current bullish momentum.
Support and Resistance Levels:
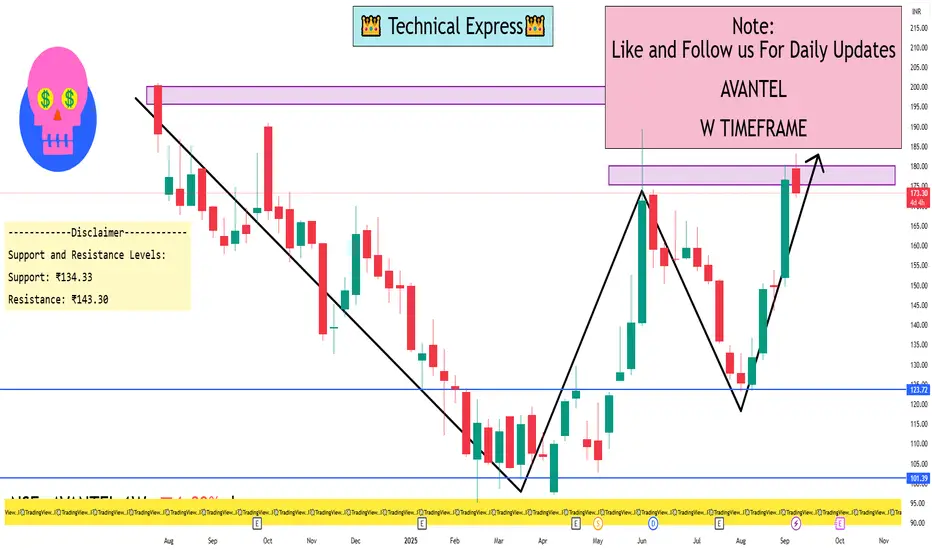
Support: ₹134.33
Resistance: ₹143.30
Moving Averages: The stock is trading above its 200-day exponential moving average (EMA), indicating a long-term uptrend.
Stochastic RSI: The stochastic RSI is in the overbought zone, suggesting potential for a short-term pullback.
MACD: The Moving Average Convergence Divergence (MACD) is above the signal line, supporting the current bullish momentum.
Support and Resistance Levels:
Support: ₹134.33
Resistance: ₹143.30
I built a Buy & Sell Signal Indicator with 85% accuracy.
📈 Get access via DM or
WhatsApp: wa.link/d997q0
Contact - +91 76782 40962
| Email: techncialexpress@gmail.com
| Script Coder | Trader | Investor | From India
📈 Get access via DM or
WhatsApp: wa.link/d997q0
Contact - +91 76782 40962
| Email: techncialexpress@gmail.com
| Script Coder | Trader | Investor | From India
関連の投稿
免責事項
この情報および投稿は、TradingViewが提供または推奨する金融、投資、トレード、その他のアドバイスや推奨を意図するものではなく、それらを構成するものでもありません。詳細は利用規約をご覧ください。