Price action and chart pattern trading setup
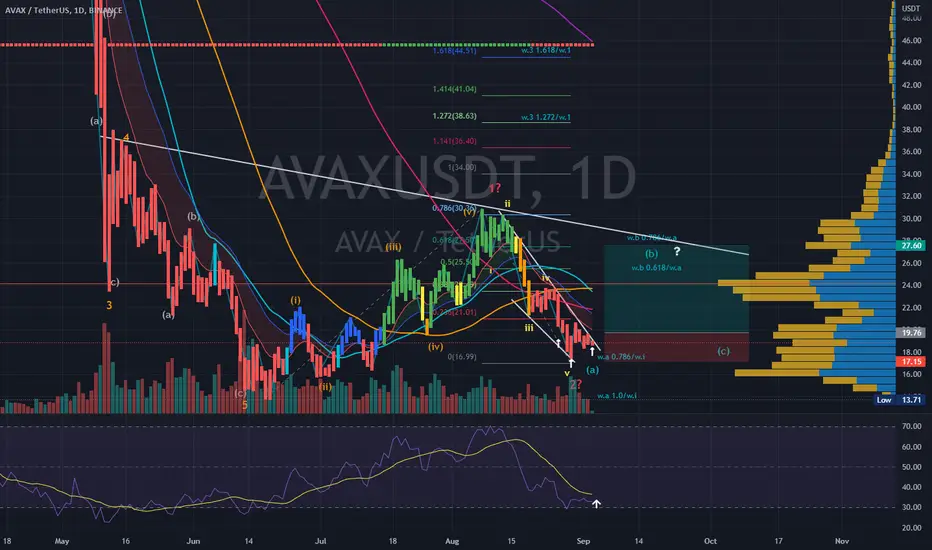
> Elliott Wave analysis possible 2-wave ending diagonal pattern with bullish momentum - a potential falling wedge breakout scenario
> Entry @ 2-wave bullish wedge breakout and EMA10 TF24H
> Target @ upper downtrend line resistance 0.618 - 0.786 retracement of 1-wave zone + 30- 40%
> Stop @ the lowest 2-wave position -10%
> Risk reward ratio: 2:1 / 3:1
Indicator:
>RSI bullish momentum about to cross MA line
>MACD bullish momentum just below signal line
Always trade with affordable risk and respect your stop
免責事項
これらの情報および投稿は、TradingViewが提供または保証する金融、投資、取引、またはその他の種類のアドバイスや推奨を意図したものではなく、またそのようなものでもありません。詳しくは利用規約をご覧ください。
免責事項
これらの情報および投稿は、TradingViewが提供または保証する金融、投資、取引、またはその他の種類のアドバイスや推奨を意図したものではなく、またそのようなものでもありません。詳しくは利用規約をご覧ください。