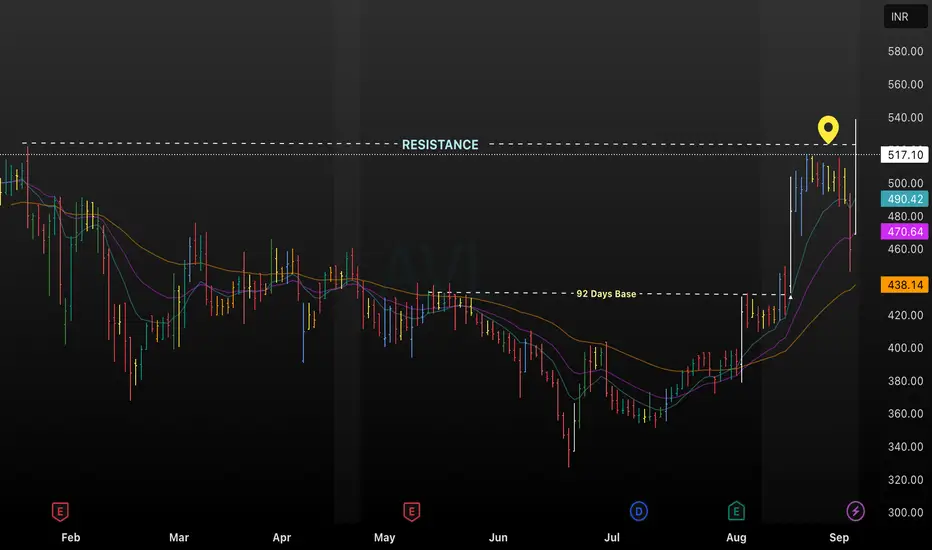
This AVL daily chart highlights a crucial resistance level near ₹540 after a robust 92-day base formation. The recent breakout above this resistance zone signals potential bullish strength, supported by moving averages (EMA 20, 50, 100, 200) currently trending upward above ₹438. A sharp price surge to ₹517 is visible, with strong momentum and historical base support, suggesting possible continuation if resistance sustains.
Use this structure to maximize engagement and provide clarity for community members or followers analyzing AVL’s price action.
Use this structure to maximize engagement and provide clarity for community members or followers analyzing AVL’s price action.
免責事項
これらの情報および投稿は、TradingViewが提供または保証する金融、投資、取引、またはその他の種類のアドバイスや推奨を意図したものではなく、またそのようなものでもありません。詳しくは利用規約をご覧ください。
免責事項
これらの情報および投稿は、TradingViewが提供または保証する金融、投資、取引、またはその他の種類のアドバイスや推奨を意図したものではなく、またそのようなものでもありません。詳しくは利用規約をご覧ください。