BALAJEE - Descending Triangle Meets Multi-Pattern Confluence
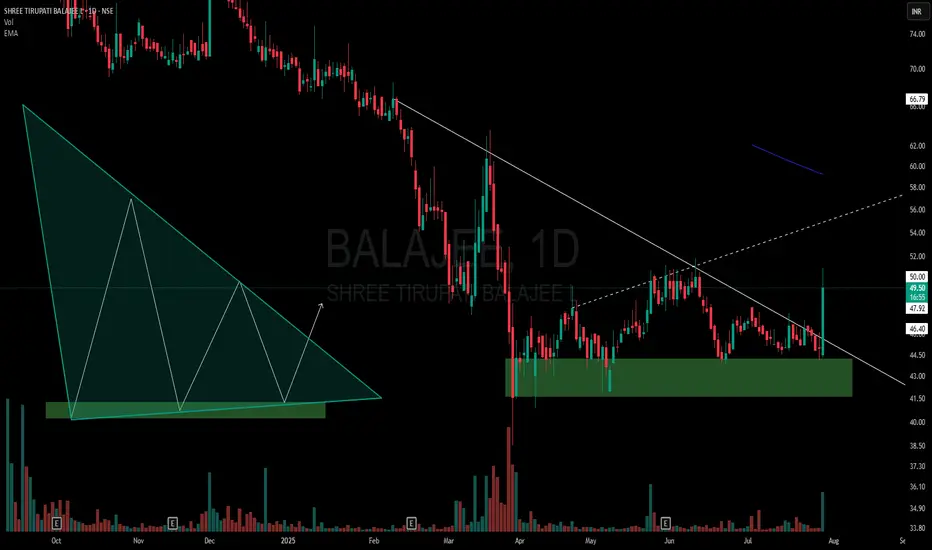
On the daily chart of Balajee, price action has formed a descending triangle right at the lower end of the trend:
🔻 Lower highs consistently pressuring horizontal support.
🟩 Price sitting within a clear demand zone, adding significance to the structure.
📊 Volume tapering off through consolidation, a classic triangle trait.
📐 Presence of a hidden counter-trend line (dotted) hinting at a potential broadening formation — showing a rare multi-pattern overlap.
Such setups are important not for predicting price, but for understanding how multiple structures can interact.
⚠️ Purely educational observation — no buy/sell advice.
🎯 Master My Self-Made Trading Strategy
📈 Telegram (Learn Today): t.me/hashtaghammer
✅ WhatsApp (Learn Today): wa.me/919455664601
📈 Telegram (Learn Today): t.me/hashtaghammer
✅ WhatsApp (Learn Today): wa.me/919455664601
関連の投稿
免責事項
この情報および投稿は、TradingViewが提供または推奨する金融、投資、トレード、その他のアドバイスや推奨を意図するものではなく、それらを構成するものでもありません。詳細は利用規約をご覧ください。