BANK NIFTY TRADING PLAN – 10-Oct-2025
📊 Chart Timeframe: 15-min
📍 Last Close: 56,143.15 | 🔻 Change: -27.40 pts (-0.05%)
📅 Analysis Based on Psychological & Technical Structure
🔍 Key Technical Zones
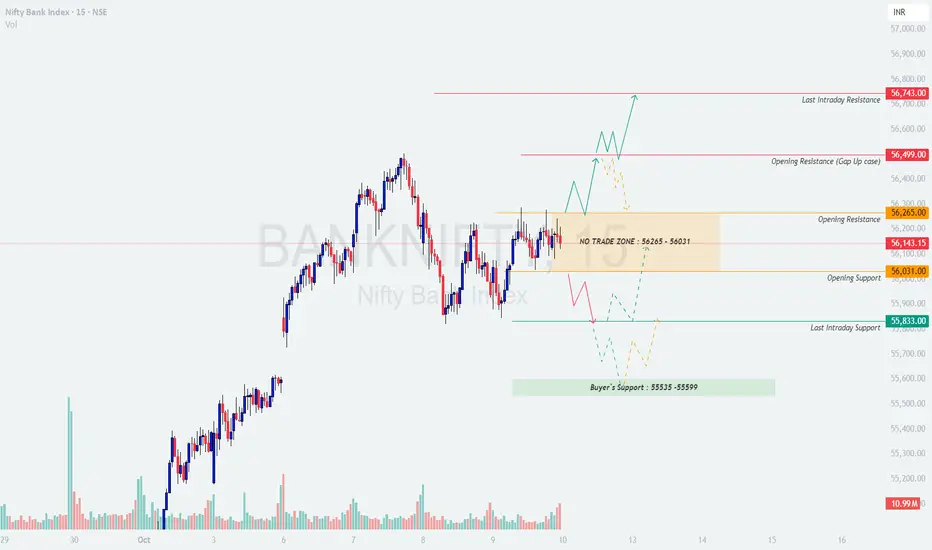
🟧 No Trade Zone: 56,265 – 56,031
🟥 Last Intraday Resistance: 56,743
🟠 Opening Resistance (Gap-Up Case): 56,499
🟩 Opening Support: 56,031
🟢 Last Intraday Support: 55,833
💚 Buyer’s Support Zone: 55,535 – 55,599
🚀 Scenario 1 – Gap Up Opening (200+ pts above 56,350)
If Bank Nifty opens near or above 56,350, it directly enters the opening resistance zone.
💡 Educational Tip:
Gap-up openings near major resistance levels are often liquidity traps. Always wait for price confirmation and volume support before taking directional trades. Patience gives better accuracy than early anticipation.
⚖️ Scenario 2 – Flat Opening (Around 56,100 ± 100 pts)
A flat opening keeps Bank Nifty inside the No Trade Zone (56,265–56,031), demanding patience and precision.
🧠 Educational Note:
Flat openings near mid-zones are “decision areas” — breakout confirmation candles (either side) generally dictate the intraday trend. Avoid overtrading during this phase.
📉 Scenario 3 – Gap Down Opening (200+ pts below 55,950)
If Bank Nifty opens near or below 55,950, it immediately enters the support-testing phase.
💬 Educational Insight:
Gap-down openings generally favor experienced traders who understand reversal patterns. Let the first 30 minutes decide whether the move is genuine or an overreaction — discipline matters more than direction here.
🛡️ Risk Management Tips for Options Traders
📊 Summary & Conclusion
🎯 Focus Zone for 10-Oct-2025:
🟩 55,599 → 55,535 (Buyers’ Defensive Zone)
🟥 56,499 → 56,743 (Sellers’ Control Zone)
📢 Disclaimer:
I am not a SEBI-registered analyst. The above analysis is meant purely for educational and informational purposes. Traders are advised to conduct their own research or consult a financial advisor before making trading decisions.
📊 Chart Timeframe: 15-min
📍 Last Close: 56,143.15 | 🔻 Change: -27.40 pts (-0.05%)
📅 Analysis Based on Psychological & Technical Structure
🔍 Key Technical Zones
🟧 No Trade Zone: 56,265 – 56,031
🟥 Last Intraday Resistance: 56,743
🟠 Opening Resistance (Gap-Up Case): 56,499
🟩 Opening Support: 56,031
🟢 Last Intraday Support: 55,833
💚 Buyer’s Support Zone: 55,535 – 55,599
🚀 Scenario 1 – Gap Up Opening (200+ pts above 56,350)
If Bank Nifty opens near or above 56,350, it directly enters the opening resistance zone.
- []Wait for the first 15–30 minutes — a strong close above 56,499 will confirm bullish continuation toward 56,743, the last intraday resistance.
[]Avoid buying immediately on open; instead, look for a healthy retest of 56,265–56,300 to establish long entries with a favorable risk/reward setup.
[]If prices face rejection from 56,499, expect mild profit booking that could drag Bank Nifty back toward the No Trade Zone (56,265–56,031).
[]Sustained rejection candles near 56,700–56,740 could trigger short opportunities for quick scalps — but only after confirmation via an hourly close below 56,499.]
💡 Educational Tip:
Gap-up openings near major resistance levels are often liquidity traps. Always wait for price confirmation and volume support before taking directional trades. Patience gives better accuracy than early anticipation.
⚖️ Scenario 2 – Flat Opening (Around 56,100 ± 100 pts)
A flat opening keeps Bank Nifty inside the No Trade Zone (56,265–56,031), demanding patience and precision.
- []If the index sustains above 56,265, intraday bulls may regain control, pushing prices toward 56,499 → 56,743.
[]A breakout candle above 56,265 with increasing volume can be used as an entry trigger for long positions.
[]On the other hand, failure to sustain above 56,031 will expose the index to weakness toward 55,833 and further down to 55,599–55,535 (Buyer’s Support).
[]Traders should ideally wait for a clean break from this zone before initiating any directional positions to avoid getting trapped in sideways movements.]
🧠 Educational Note:
Flat openings near mid-zones are “decision areas” — breakout confirmation candles (either side) generally dictate the intraday trend. Avoid overtrading during this phase.
📉 Scenario 3 – Gap Down Opening (200+ pts below 55,950)
If Bank Nifty opens near or below 55,950, it immediately enters the support-testing phase.
- []Monitor reactions closely near 55,833–55,800; a sharp recovery from this zone may trigger short-covering rallies toward 56,031–56,100.
[]However, sustained weakness below 55,800 may lead prices toward the critical Buyer’s Support Zone (55,535–55,599) — a must-hold area for bulls.
[]A 15-min close below 55,535 can attract panic selling and accelerate downside momentum toward 55,300–55,250.
[]Avoid aggressive buying in a gap-down scenario unless there’s a clear reversal candle or double-bottom formation within the buyer’s zone.]
💬 Educational Insight:
Gap-down openings generally favor experienced traders who understand reversal patterns. Let the first 30 minutes decide whether the move is genuine or an overreaction — discipline matters more than direction here.
🛡️ Risk Management Tips for Options Traders
- []Never risk more than 2%–3% of trading capital per trade.
[]Use a stop loss based on 15-min candle close, not random points.
[]Avoid buying deep OTM options — focus on ATM or slightly ITM for better delta exposure.
[]When volatility is high, consider using vertical spreads (Bull Call / Bear Put) to manage theta decay.
[]Book partial profits at 1:1 risk–reward; let the rest trail with stop adjustments.
[]Do not hold losing positions beyond 2:45 PM — protect your capital before time decay erodes premiums. 💎]
📊 Summary & Conclusion
- []Bank Nifty currently trades within a consolidation band, with directional clarity expected only outside 56,265–56,031.
[]Above 56,499, momentum buyers may target 56,743, while sustained weakness below 55,833 can pull prices toward 55,599–55,535. - Traders should prioritize level confirmations, volume analysis, and strict stop-loss adherence for consistent performance.]
🎯 Focus Zone for 10-Oct-2025:
🟩 55,599 → 55,535 (Buyers’ Defensive Zone)
🟥 56,499 → 56,743 (Sellers’ Control Zone)
📢 Disclaimer:
I am not a SEBI-registered analyst. The above analysis is meant purely for educational and informational purposes. Traders are advised to conduct their own research or consult a financial advisor before making trading decisions.
免責事項
この情報および投稿は、TradingViewが提供または推奨する金融、投資、トレード、その他のアドバイスや推奨を意図するものではなく、それらを構成するものでもありません。詳細は利用規約をご覧ください。
免責事項
この情報および投稿は、TradingViewが提供または推奨する金融、投資、トレード、その他のアドバイスや推奨を意図するものではなく、それらを構成するものでもありません。詳細は利用規約をご覧ください。