Hello traders! Hope you’re all doing great. It’s fascinating how price respects geometry the way horizontal structures merge with rising supports often reveals the market’s true rhythm, So let's explore it.
BANKNIFTY – The Range Breakout Story & What’s Next?
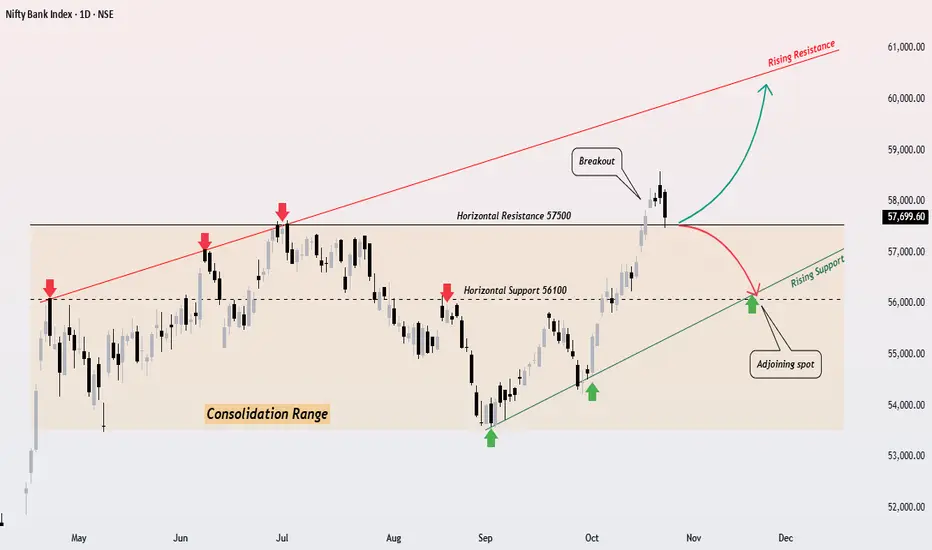
After spending months trapped between 53500–57500, Bank Nifty has finally broken above the consolidation range, hinting at a potential shift in momentum.
This zone acted like a strong horizontal cage every attempt to rise above 57500 had been rejected earlier. But this time, the breakout came with conviction. Now, the index seems to be retesting the breakout zone, a common and healthy behavior before a potential next leg up.
Technical Structure at a Glance--::
🧩Horizontal Resistance: 57500
🧩Horizontal Support: 56100
🧩Rising Support Trendline aligning perfectly near the retest zone
🧩Rising Resistance: pointing toward the 60000–60500 region
What the Chart Suggests ?
Bullish View:
If Bank Nifty respects the 57500-57000 zone (a confluence of old resistance + rising support), we might witness the next rally phase towards 60000+, aligning with the rising resistance trendline.
Bearish View:
A decisive close below 57500 will negate the bullish bias and can drag prices back toward the mid-range zone around 56100-55000.
Chart Reading Insight--::
A breakout followed by a controlled pullback is often the market’s way of “testing conviction.”
As long as structure and rising support hold the uptrend narrative remains intact.
Takeaway--::
The 57500–57000 band will decide the fate of this breakout
Hold above = continuation rally 🟢
Break below = structure reset 🔴
Have a nice week Ahead- Amit.
BANKNIFTY – The Range Breakout Story & What’s Next?
After spending months trapped between 53500–57500, Bank Nifty has finally broken above the consolidation range, hinting at a potential shift in momentum.
This zone acted like a strong horizontal cage every attempt to rise above 57500 had been rejected earlier. But this time, the breakout came with conviction. Now, the index seems to be retesting the breakout zone, a common and healthy behavior before a potential next leg up.
Technical Structure at a Glance--::
🧩Horizontal Resistance: 57500
🧩Horizontal Support: 56100
🧩Rising Support Trendline aligning perfectly near the retest zone
🧩Rising Resistance: pointing toward the 60000–60500 region
What the Chart Suggests ?
Bullish View:
If Bank Nifty respects the 57500-57000 zone (a confluence of old resistance + rising support), we might witness the next rally phase towards 60000+, aligning with the rising resistance trendline.
Bearish View:
A decisive close below 57500 will negate the bullish bias and can drag prices back toward the mid-range zone around 56100-55000.
Chart Reading Insight--::
A breakout followed by a controlled pullback is often the market’s way of “testing conviction.”
As long as structure and rising support hold the uptrend narrative remains intact.
Takeaway--::
The 57500–57000 band will decide the fate of this breakout
Hold above = continuation rally 🟢
Break below = structure reset 🔴
Have a nice week Ahead- Amit.
免責事項
これらの情報および投稿は、TradingViewが提供または保証する金融、投資、取引、またはその他の種類のアドバイスや推奨を意図したものではなく、またそのようなものでもありません。詳しくは利用規約をご覧ください。
免責事項
これらの情報および投稿は、TradingViewが提供または保証する金融、投資、取引、またはその他の種類のアドバイスや推奨を意図したものではなく、またそのようなものでもありません。詳しくは利用規約をご覧ください。