ankNifty Futures (Index) daily
Technical analysis + sector (banking industry) fundamental overview + a learning summary for students.
Technical Analysis (Daily Chart) Candlestick & Chart Pattern👉
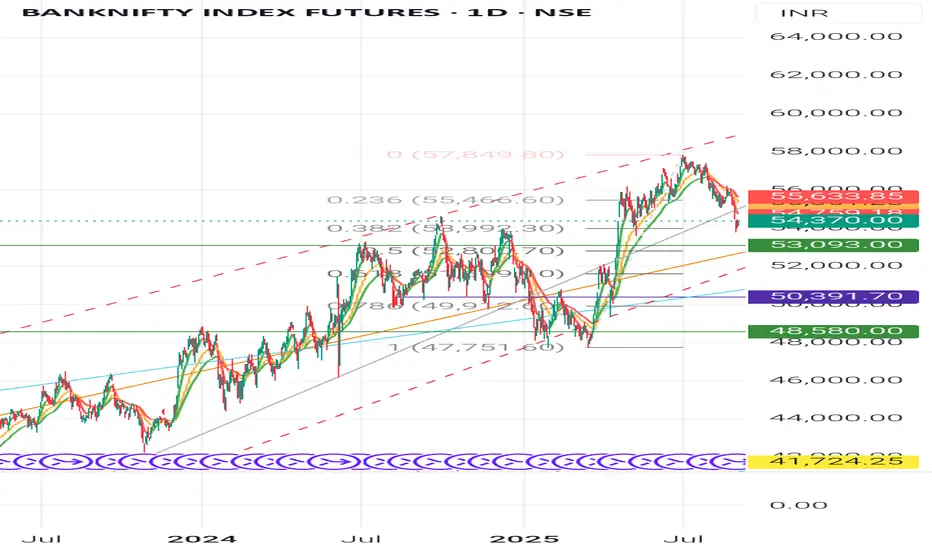
Recent candles show selling pressure after the peak near 57,800 (upper trendline rejection).
Current candles look like lower highs + lower lows = possible descending channel formation.
The long wicks at support zones indicate buyers are defending near 52,800- 53,000.
Swing Analysis
Major swing high: 57,850
Swing low: 47,750
Retracement happening between 0.382 (53,992) and 0.236 (55,466) Fibonacci levels.
Pattern in Progress
Falling Wedge / Descending Channel forming- often bullish if breakout happens above resistance trendline.
👉If price breaks below 52,800, then deeper correction possible.
Key Levels
-Support
52,800 - 53,000 (critical Fib support)
50,400 - 50,500 (strong demand zone)
48,500 (swing support)
-Resistance
55,000 - 55,500 (Fib cluster + recent rejection)
57,800 (swing high, big breakout point)
60,000 psychological level
Entry Points-
For Long (Investors/Positional)
-Enter near 52,800- 53,000 with SL below 52,500.
Add more if it breaks and sustains above 55,500.
-For Short (Traders):
Below 52,800, short with target 50,400 - 48,500.
Keep SL near 53,600.
Industry Analysis (Banking Sector)
Indian banks are in a strong credit growth cycle (loan demand high, NPA ratios declining).
-RBI’s monetary policy easing in future may improve margins further.
-PSU Banks are gaining strength, but private banks (HDFC, ICICI, Kotak) still dominate.
-Key Fundamental Ratios (Peer Banks)
-ICICI Bank: RoE - 16%, NIM - 4.5%, GNPA <2%
-HDFC Bank: RoE - 15%, NIM - 4.1%, GNPA - 1.5%
-SBI: RoE - 14%, NIM - 3.6%, GNPA - 2.5%
👉 Overall, sector health is positive, but valuation of large banks is already at premium.
-Student Learnings
1. Chart Patterns:
Descending channel/falling wedge = watch for breakouts.
2. Candlestick Wicks:
Long lower shadows = hidden buying.
3. Swing + Fibonacci:
Key tool to identify retracement zones.
4. Support & Resistance:
Always mark levels - entry becomes safer.
5. Fundamentals in Sector Indices:
Index = basket - study sector & top-weight banks, not single balance sheet.
⚠️ Disclaimer
This analysis is for educational purposes only. It is not financial advice. Trading in derivatives (like BankNifty Futures) is highly risky and may lead to capital loss. Please consult your financial advisor before investing.
Follow👣 for more🚩
#BankNifty #StockMarketIndia #TechnicalAnalysis #CandlestickPatterns #SwingTrading #SupportAndResistance #InvestingBasics #BankingSector #StockMarketEducation #FinanceStudents #MarketAnalysis
Technical analysis + sector (banking industry) fundamental overview + a learning summary for students.
Technical Analysis (Daily Chart) Candlestick & Chart Pattern👉
Recent candles show selling pressure after the peak near 57,800 (upper trendline rejection).
Current candles look like lower highs + lower lows = possible descending channel formation.
The long wicks at support zones indicate buyers are defending near 52,800- 53,000.
Swing Analysis
Major swing high: 57,850
Swing low: 47,750
Retracement happening between 0.382 (53,992) and 0.236 (55,466) Fibonacci levels.
Pattern in Progress
Falling Wedge / Descending Channel forming- often bullish if breakout happens above resistance trendline.
👉If price breaks below 52,800, then deeper correction possible.
Key Levels
-Support
52,800 - 53,000 (critical Fib support)
50,400 - 50,500 (strong demand zone)
48,500 (swing support)
-Resistance
55,000 - 55,500 (Fib cluster + recent rejection)
57,800 (swing high, big breakout point)
60,000 psychological level
Entry Points-
For Long (Investors/Positional)
-Enter near 52,800- 53,000 with SL below 52,500.
Add more if it breaks and sustains above 55,500.
-For Short (Traders):
Below 52,800, short with target 50,400 - 48,500.
Keep SL near 53,600.
Industry Analysis (Banking Sector)
Indian banks are in a strong credit growth cycle (loan demand high, NPA ratios declining).
-RBI’s monetary policy easing in future may improve margins further.
-PSU Banks are gaining strength, but private banks (HDFC, ICICI, Kotak) still dominate.
-Key Fundamental Ratios (Peer Banks)
-ICICI Bank: RoE - 16%, NIM - 4.5%, GNPA <2%
-HDFC Bank: RoE - 15%, NIM - 4.1%, GNPA - 1.5%
-SBI: RoE - 14%, NIM - 3.6%, GNPA - 2.5%
👉 Overall, sector health is positive, but valuation of large banks is already at premium.
-Student Learnings
1. Chart Patterns:
Descending channel/falling wedge = watch for breakouts.
2. Candlestick Wicks:
Long lower shadows = hidden buying.
3. Swing + Fibonacci:
Key tool to identify retracement zones.
4. Support & Resistance:
Always mark levels - entry becomes safer.
5. Fundamentals in Sector Indices:
Index = basket - study sector & top-weight banks, not single balance sheet.
⚠️ Disclaimer
This analysis is for educational purposes only. It is not financial advice. Trading in derivatives (like BankNifty Futures) is highly risky and may lead to capital loss. Please consult your financial advisor before investing.
Follow👣 for more🚩
#BankNifty #StockMarketIndia #TechnicalAnalysis #CandlestickPatterns #SwingTrading #SupportAndResistance #InvestingBasics #BankingSector #StockMarketEducation #FinanceStudents #MarketAnalysis
関連の投稿
免責事項
これらの情報および投稿は、TradingViewが提供または保証する金融、投資、取引、またはその他の種類のアドバイスや推奨を意図したものではなく、またそのようなものでもありません。詳しくは利用規約をご覧ください。
関連の投稿
免責事項
これらの情報および投稿は、TradingViewが提供または保証する金融、投資、取引、またはその他の種類のアドバイスや推奨を意図したものではなく、またそのようなものでもありません。詳しくは利用規約をご覧ください。