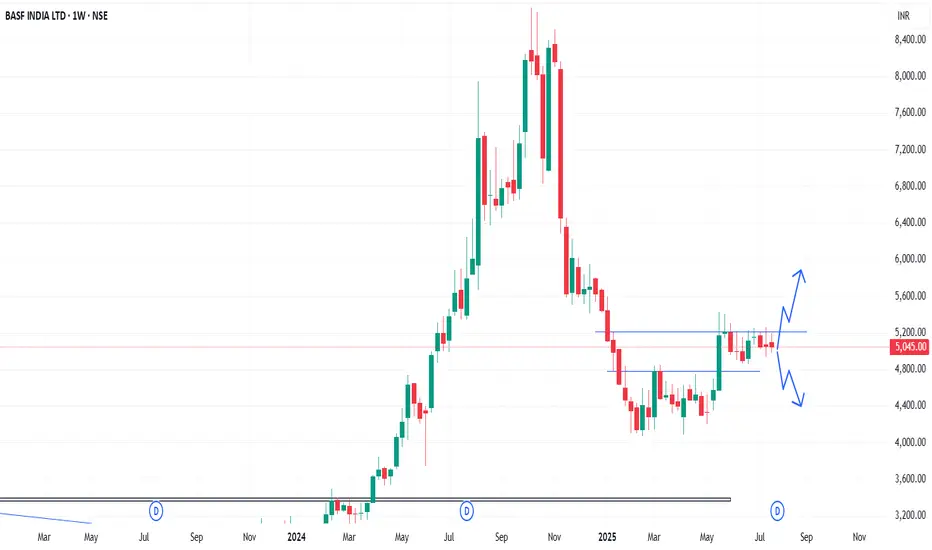
In the Weekly Chart of BASF ,
we can see that, it has consolidated near trendline.
Also, it is at decision making point.
Possible momentums are shown in chart.
we can see that, it has consolidated near trendline.
Also, it is at decision making point.
Possible momentums are shown in chart.
免責事項
この情報および投稿は、TradingViewが提供または推奨する金融、投資、トレード、その他のアドバイスや推奨を意図するものではなく、それらを構成するものでもありません。詳細は利用規約をご覧ください。
免責事項
この情報および投稿は、TradingViewが提供または推奨する金融、投資、トレード、その他のアドバイスや推奨を意図するものではなく、それらを構成するものでもありません。詳細は利用規約をご覧ください。