📊 Daily Support and Resistance Levels
Immediate Support: ₹1,204.27
Short-Term Support: ₹1,188.23
Key Resistance: ₹1,245.83
Short-Term Resistance: ₹1,233.07
🔁 Pivot Points (Daily)
Central Pivot Point (CPR): ₹1,217.03
Resistance Levels: ₹1,245.83, ₹1,261.87
Support Levels: ₹1,175.47, ₹1,188.23
📈 Technical Indicators
Relative Strength Index (RSI): Currently, the RSI is between 45 and 55, indicating a neutral market condition.
Moving Averages: The stock is trading near its short-term moving averages, suggesting a consolidation phase.
Volume: Moderate trading volume observed, indicating steady investor interest.
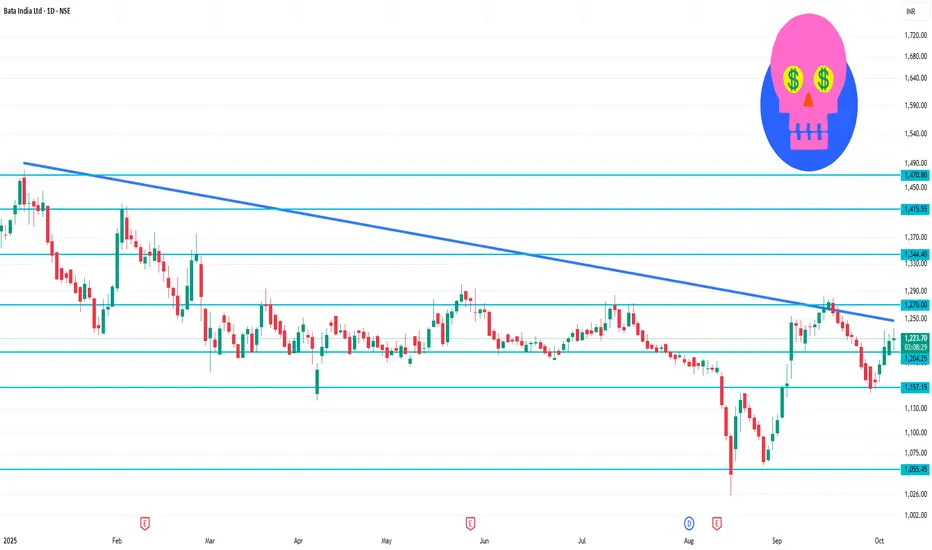
✅ Trade Insights
Bata India Ltd is currently in a neutral trend on the daily chart. A breakout above ₹1,245.83 could signal a bullish move towards ₹1,261.87. Conversely, a drop below ₹1,204.27 may indicate further downside.
Immediate Support: ₹1,204.27
Short-Term Support: ₹1,188.23
Key Resistance: ₹1,245.83
Short-Term Resistance: ₹1,233.07
🔁 Pivot Points (Daily)
Central Pivot Point (CPR): ₹1,217.03
Resistance Levels: ₹1,245.83, ₹1,261.87
Support Levels: ₹1,175.47, ₹1,188.23
📈 Technical Indicators
Relative Strength Index (RSI): Currently, the RSI is between 45 and 55, indicating a neutral market condition.
Moving Averages: The stock is trading near its short-term moving averages, suggesting a consolidation phase.
Volume: Moderate trading volume observed, indicating steady investor interest.
✅ Trade Insights
Bata India Ltd is currently in a neutral trend on the daily chart. A breakout above ₹1,245.83 could signal a bullish move towards ₹1,261.87. Conversely, a drop below ₹1,204.27 may indicate further downside.
関連の投稿
免責事項
これらの情報および投稿は、TradingViewが提供または保証する金融、投資、取引、またはその他の種類のアドバイスや推奨を意図したものではなく、またそのようなものでもありません。詳しくは利用規約をご覧ください。
関連の投稿
免責事項
これらの情報および投稿は、TradingViewが提供または保証する金融、投資、取引、またはその他の種類のアドバイスや推奨を意図したものではなく、またそのようなものでもありません。詳しくは利用規約をご覧ください。