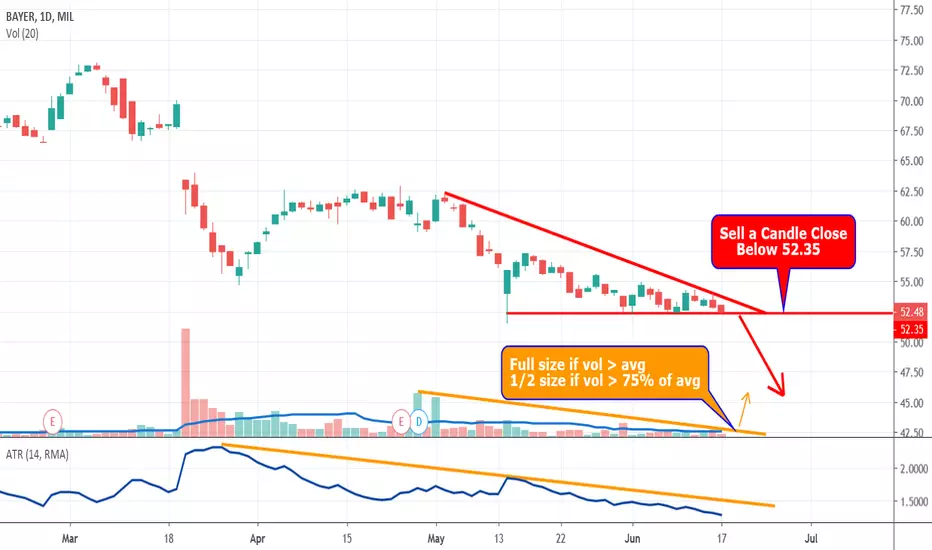
Bayer is a descending Triangle Chart Pattern
Strong support level has been re-tested several times
Continually lower highs puts pressure on this support level
Best patterns have dropping volume and volatility/ATR
Fewer traders are interested in this consolidatation
At some point expect an explosive breakout
Trade Plan
Wait for a close below the support level
Full trade size if volume is at average atr line
1/2 trade size as long as bar has 75% of average volume
Enter two trade
Both trades SL is 1.5xATR
1st trade TP is 1xATR
2nd trade no TP let profit run
When price hits 1st TP move 2nd trade AL to breakeven
Let profit run
If breakout candle is more than 1 ATR wait for price to retrace back towards 1 ATR level to enter
ノート
We are doing a live triangle trading class on our TTT Strategy June 21st @ 2PM ET! If you are interested in learning more about it, please visit the link you see below in our signature. Thanks!ノート
Sorry the 25th not 21stノート
Entry Point - SL - 1st TP免責事項
これらの情報および投稿は、TradingViewが提供または保証する金融、投資、取引、またはその他の種類のアドバイスや推奨を意図したものではなく、またそのようなものでもありません。詳しくは利用規約をご覧ください。
免責事項
これらの情報および投稿は、TradingViewが提供または保証する金融、投資、取引、またはその他の種類のアドバイスや推奨を意図したものではなく、またそのようなものでもありません。詳しくは利用規約をご覧ください。