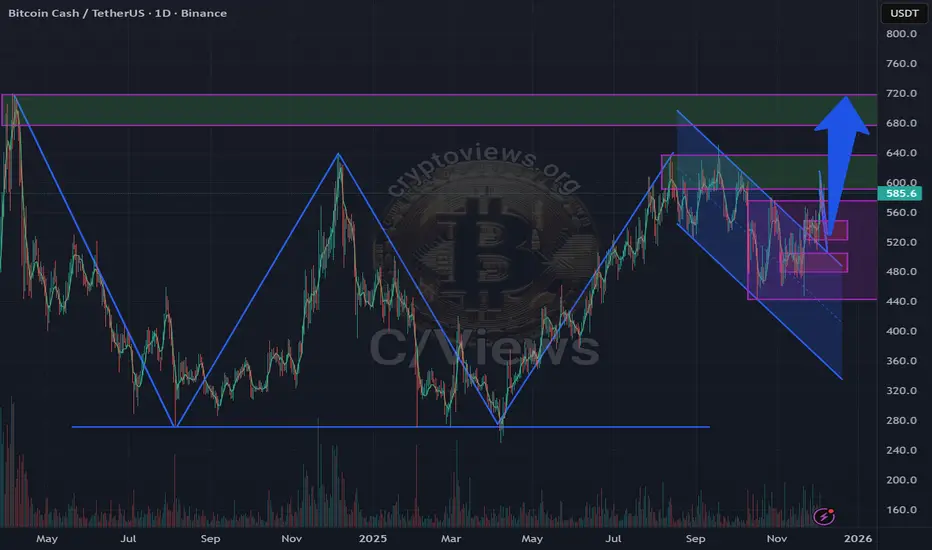
A W-pattern has formed on BCH, but the current breakout is accompanied by a bullish flag with a long flagpole. Key liquidity zones remain below the price, so a pullback and a possible false breakout before the rally are likely.
The prolonged accumulation since October 2025 increases the upside potential. If there is no reaction in the coming days, a retest of the 0.5 level of the sideways trend, coinciding with the boundary of the global flag, is possible, the current breakout could be false.
Long-term upside potential remains until the upper liquidity zones.
Full breakdown on website
免責事項
この情報および投稿は、TradingViewが提供または推奨する金融、投資、トレード、その他のアドバイスや推奨を意図するものではなく、それらを構成するものでもありません。詳細は利用規約をご覧ください。
免責事項
この情報および投稿は、TradingViewが提供または推奨する金融、投資、トレード、その他のアドバイスや推奨を意図するものではなく、それらを構成するものでもありません。詳細は利用規約をご覧ください。