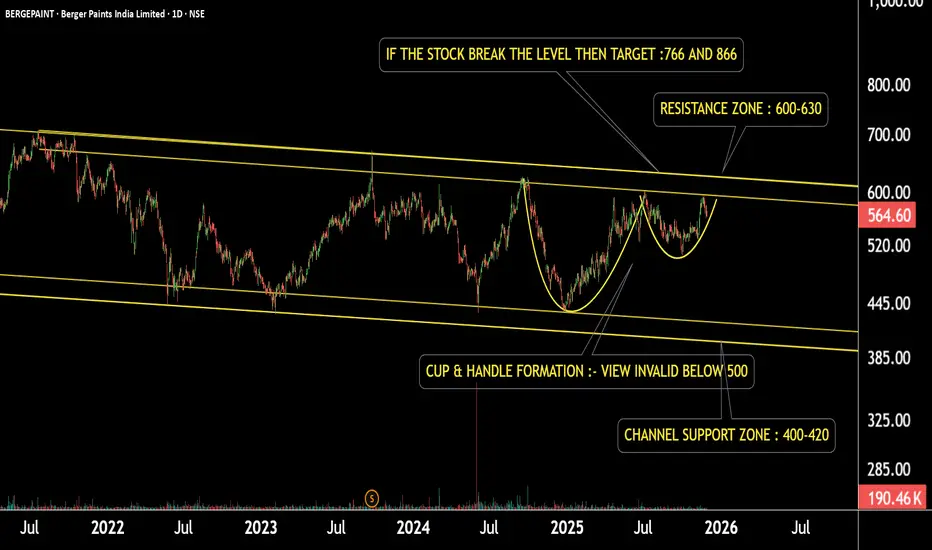
This is the daily timeframe chart of Berger Paint.
The stock is moving within a well-defined channel and has formed a Cup & Handle pattern inside the structure.
If the pattern continues to hold and the price stays above ₹500, the pattern remains valid.
A breakout above the resistance may trigger potential upside targets of ₹766 and ₹866.
However, if the price fails and breaks below this zone, the stock may decline toward the channel support near ₹400.
Thank you.
@RahulSaraoge
Connect us at t.me/stridesadvisory
Connect us at t.me/stridesadvisory
免責事項
この情報および投稿は、TradingViewが提供または推奨する金融、投資、トレード、その他のアドバイスや推奨を意図するものではなく、それらを構成するものでもありません。詳細は利用規約をご覧ください。
@RahulSaraoge
Connect us at t.me/stridesadvisory
Connect us at t.me/stridesadvisory
免責事項
この情報および投稿は、TradingViewが提供または推奨する金融、投資、トレード、その他のアドバイスや推奨を意図するものではなく、それらを構成するものでもありません。詳細は利用規約をご覧ください。