$bert around the poc and htf levels
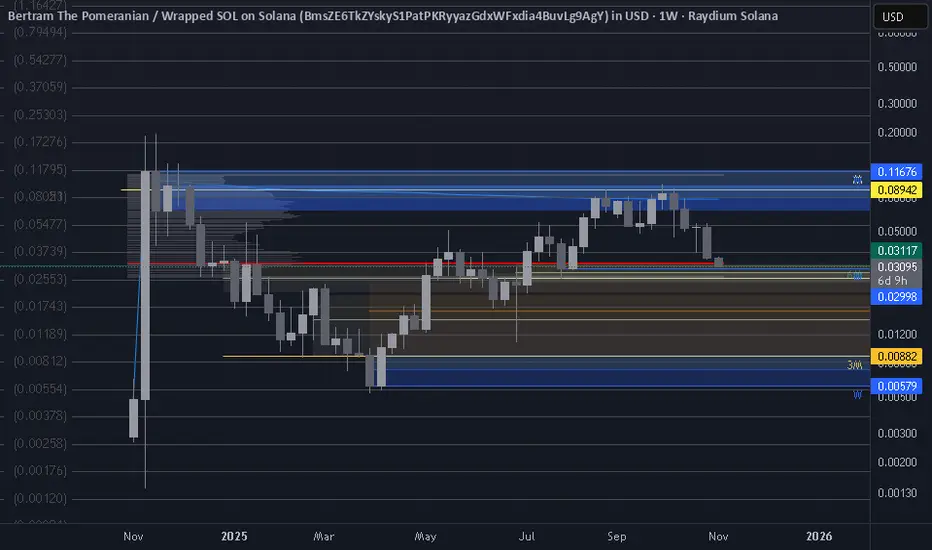
you want to be looking at $bert around 2c-3c, the chart is backtesting the volume POC, and has a cluster of htf monthly levels and the VAL just below 3c. Grid cheat sheet for horizontal S&R
免責事項
この情報および投稿は、TradingViewが提供または推奨する金融、投資、トレード、その他のアドバイスや推奨を意図するものではなく、それらを構成するものでもありません。詳細は利用規約をご覧ください。
免責事項
この情報および投稿は、TradingViewが提供または推奨する金融、投資、トレード、その他のアドバイスや推奨を意図するものではなく、それらを構成するものでもありません。詳細は利用規約をご覧ください。