🔍 Current Price & Context
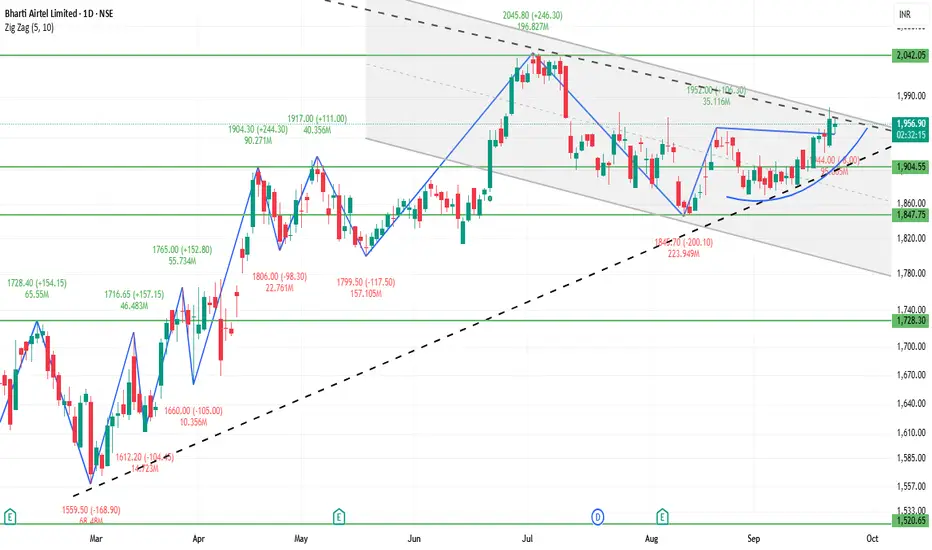
Trading around ₹1,950 – ₹1,960 (approx).
Day’s range recently: low ~ ₹1,944 – ₹1,946, high ~ ₹1,920 – ₹1,925 — showing testing of resistance.
52-week range: low ~ ₹1,510, high ~ ₹2,045.
🧮 Strategy / Trade Ideas
Long Setup:
Entry could be around / just above support zone (₹1,900 – ₹1,895) if there are reversal signals (bullish candles, volume).
Stop loss: slightly below deeper support (~₹1,870 – ₹1,880) to protect against breakdown.
Initial target: resistance around ₹1,920 – ₹1,930. If crossed, then next target near ₹1,950 – ₹1,960.
Short / Pullback Setup:
If price fails to break above resistance (~₹1,920 – ₹1,930) and shows signs of reversal (bearish candle, volume drop).
Target downward to support ~₹1,900, then further to ~₹1,880 – ₹1,870.
Breakout Setup:
If it breaks above ~₹1,950 – ₹1,960 with good volume, then move toward psychological level ~₹2,000 and possibly toward 52-week high (~₹2,045).
✅ Summary
Bharti Airtel in daily chart is showing a mild bullish bias, but the resistance zones (~₹1,920-₹1,930, ₹1,950-₹1,960) are critical. Holding above support around ₹1,900 is important. A clear breakout above resistance could open room for upside; failure to do so may lead to sideways movement or slight downside.
関連の投稿
免責事項
この情報および投稿は、TradingViewが提供または推奨する金融、投資、トレード、その他のアドバイスや推奨を意図するものではなく、それらを構成するものでもありません。詳細は利用規約をご覧ください。
関連の投稿
免責事項
この情報および投稿は、TradingViewが提供または推奨する金融、投資、トレード、その他のアドバイスや推奨を意図するものではなく、それらを構成するものでもありません。詳細は利用規約をご覧ください。