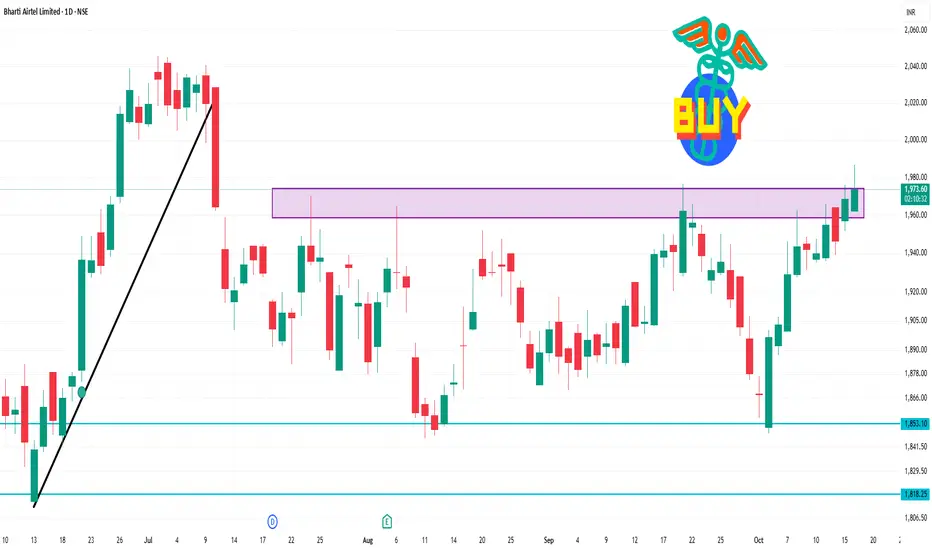
Bharti Airtel Limited is trading at ₹1,973.50, reflecting a 0.31% increase from the previous close.
Technical Analysis Overview (1-Day Time Frame):
Trend: Neutral to mildly bullish
Support Levels: ₹1,900 – ₹1,895
Resistance Levels: ₹1,920 – ₹1,925 and ₹1,950 – ₹1,960
Key Technical Indicators:
Moving Averages: All major moving averages (20-day, 50-day, 200-day) are bullish, indicating upward momentum.
Relative Strength Index (RSI): At 55.9, suggesting a neutral stance, neither overbought nor oversold.
Commodity Channel Index (CCI): At -214.32, indicating a bullish condition.
Momentum Oscillator: Positive, reinforcing the bullish outlook.
Average Directional Index (ADX): At 20.28, suggesting a neutral trend strength.
関連の投稿
免責事項
これらの情報および投稿は、TradingViewが提供または保証する金融、投資、取引、またはその他の種類のアドバイスや推奨を意図したものではなく、またそのようなものでもありません。詳しくは利用規約をご覧ください。
関連の投稿
免責事項
これらの情報および投稿は、TradingViewが提供または保証する金融、投資、取引、またはその他の種類のアドバイスや推奨を意図したものではなく、またそのようなものでもありません。詳しくは利用規約をご覧ください。