Current Price Snapshot
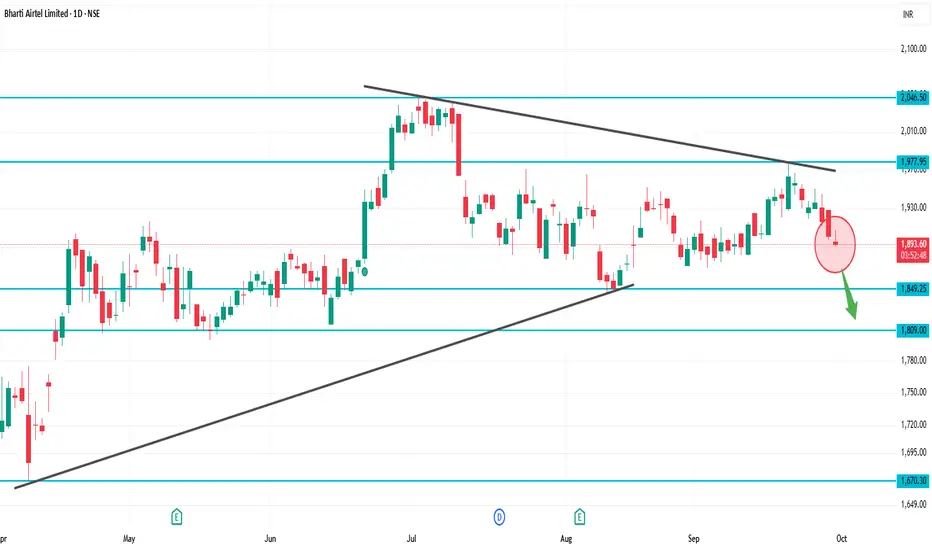
Current Price: ₹1,897.80
Day’s Range: ₹1,890.80 – ₹1,907.60
52-Week Range: ₹1,511.00 – ₹2,045.80
Technical Indicators
RSI (14-day): 44.19 — indicates a neutral to slightly bearish momentum.
MACD: -4.010 — suggests bearish momentum.
Moving Averages:
5-day: ₹1,896.00 — indicates a Sell signal.
50-day: ₹1,890.00 — indicates a Sell signal.
200-day: ₹1,850.00 — indicates a Buy signal.
Technical Summary: Predominantly Sell signals across various indicators.
Summary
Above ₹1,907.60: Potential rise toward ₹1,920 – ₹1,940.
Below ₹1,890.80: Potential fall toward ₹1,880 – ₹1,860.
Between ₹1,860 – ₹1,900: Likely range-bound movement.
関連の投稿
免責事項
この情報および投稿は、TradingViewが提供または推奨する金融、投資、トレード、その他のアドバイスや推奨を意図するものではなく、それらを構成するものでもありません。詳細は利用規約をご覧ください。
関連の投稿
免責事項
この情報および投稿は、TradingViewが提供または推奨する金融、投資、トレード、その他のアドバイスや推奨を意図するものではなく、それらを構成するものでもありません。詳細は利用規約をご覧ください。