BNB Daily – After the Run, Testing Its Range
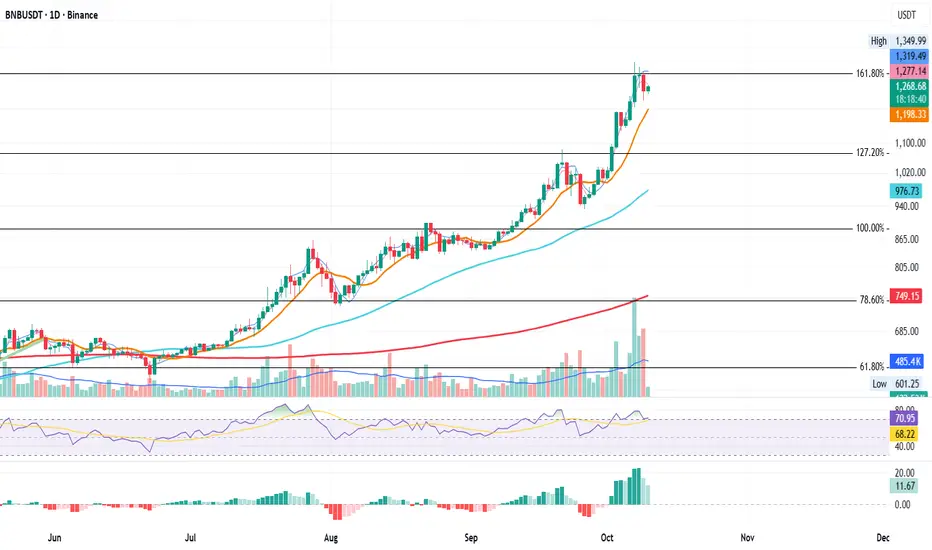
Since July, BNB has delivered an impressive rally. Back then, price was sitting near the 61.8% Fibonacci level, and from there it climbed all the way to a new all-time high at the 161.8% Fib extension, which is now acting as resistance.
On October 7 and 8, intraday moves briefly pushed above this level, but both sessions failed to close above it, leading to a clear rejection on October 9, confirmed by a large downside volume bar.
From a system perspective, the structure remains in an uptrend, with MLR > SMA > Price > BBc
indicating that despite the pullback, the broader bullish structure is still valid.
Key levels to watch:
Resistance: 161.8% Fib at $1310
Support: BB Center (orange) at $1198
If BNB can hold above the BB Center, it keeps the upper hand and could attempt another move toward its ATH.
However, a daily close below the BB Center would shift the short-term momentum bearish, opening room for further downside.
Periods like this often decide whether a move becomes continuation or distribution: patience around key levels pays off.
Bias:
Neutral-bullish — uptrend intact, but watching the BB Center closely for confirmation.
Always take profits and manage risk.
Interaction is welcome.
免責事項
これらの情報および投稿は、TradingViewが提供または保証する金融、投資、取引、またはその他の種類のアドバイスや推奨を意図したものではなく、またそのようなものでもありません。詳しくは利用規約をご覧ください。
免責事項
これらの情報および投稿は、TradingViewが提供または保証する金融、投資、取引、またはその他の種類のアドバイスや推奨を意図したものではなく、またそのようなものでもありません。詳しくは利用規約をご覧ください。