This analysis is based on the Initiative Analysis (IA) method.
Hello traders and investors!
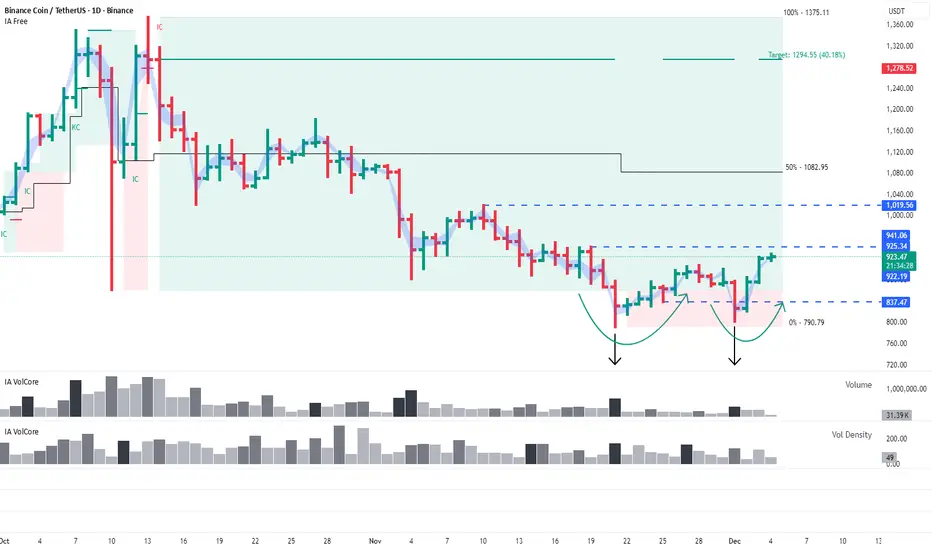
A reminder: the daily timeframe is still in a sideways range.
At its lower boundary, another false-break pattern has formed — this time at the 837 level: a seller’s attack on high volume followed by a confident absorption by buyers.
The nearest targets remain the same: 941 and 1019.
Wishing you profitable trades!
Hello traders and investors!
A reminder: the daily timeframe is still in a sideways range.
At its lower boundary, another false-break pattern has formed — this time at the 837 level: a seller’s attack on high volume followed by a confident absorption by buyers.
The nearest targets remain the same: 941 and 1019.
Wishing you profitable trades!
Рыночные сценарии, инструкция к индикатору, практические примеры — t.me/ialogic
Market scenarios, indicator guide, practical examples — t.me/initiativeanalysis
Clarity on the Chart. Smart Trading Decisions
Market scenarios, indicator guide, practical examples — t.me/initiativeanalysis
Clarity on the Chart. Smart Trading Decisions
関連の投稿
免責事項
この情報および投稿は、TradingViewが提供または推奨する金融、投資、トレード、その他のアドバイスや推奨を意図するものではなく、それらを構成するものでもありません。詳細は利用規約をご覧ください。