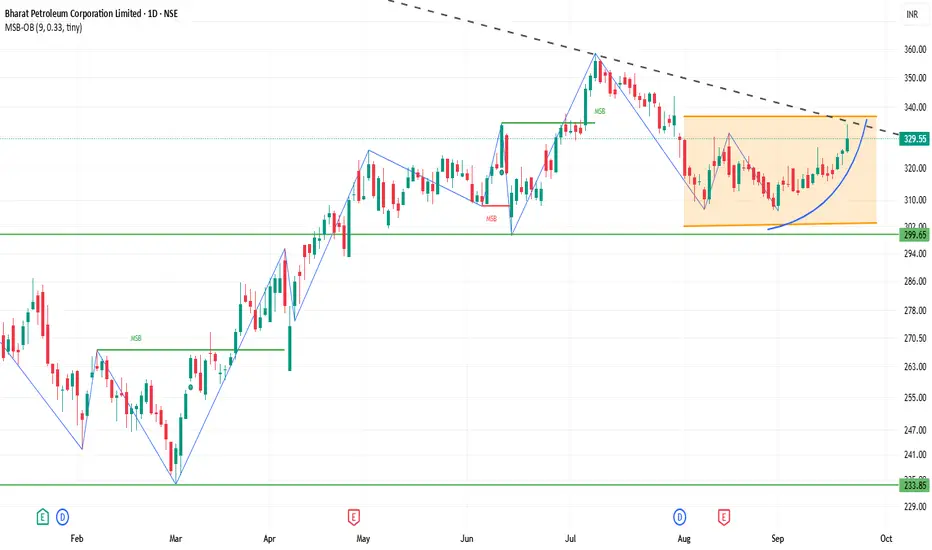
📊 Current Snapshot
Closing Price: ₹329.55
Day's Range: ₹324.80 – ₹334.00
52-Week Range: ₹234.01 – ₹376.00
Market Capitalization: ₹1,42,975 Crores
Volume: Approximately 10 million shares traded
P/E Ratio: 8.14
Dividend Yield: 2.99%
⚙️ Technical Indicators
Relative Strength Index (RSI): 60.31 – Neutral to slightly bullish
Moving Average Convergence Divergence (MACD): 0.29 – Neutral
Moving Averages: Short-term averages (5, 10, 20, 50, 100, 200-day) are above the current price, indicating potential resistance.
Pivot Points: Central pivot around ₹322.30, suggesting a balanced market sentiment.
🎯 Possible Scenarios
Bullish Scenario: A breakout above ₹328.25 with strong volume could target ₹331.80 and higher levels.
Bearish Scenario: Failure to hold above ₹325.85 may lead to a decline toward ₹322.30.
⚠️ Key Considerations
Market Sentiment: BPCL has shown strong performance recently, but broader market conditions can impact its movement.
Volume Analysis: Watch for volume spikes to confirm breakout or breakdown signals.
Technical Indicators: While the RSI indicates a neutral to slightly bullish stance, the MACD and moving averages suggest caution.
関連の投稿
免責事項
この情報および投稿は、TradingViewが提供または推奨する金融、投資、トレード、その他のアドバイスや推奨を意図するものではなく、それらを構成するものでもありません。詳細は利用規約をご覧ください。
関連の投稿
免責事項
この情報および投稿は、TradingViewが提供または推奨する金融、投資、トレード、その他のアドバイスや推奨を意図するものではなく、それらを構成するものでもありません。詳細は利用規約をご覧ください。