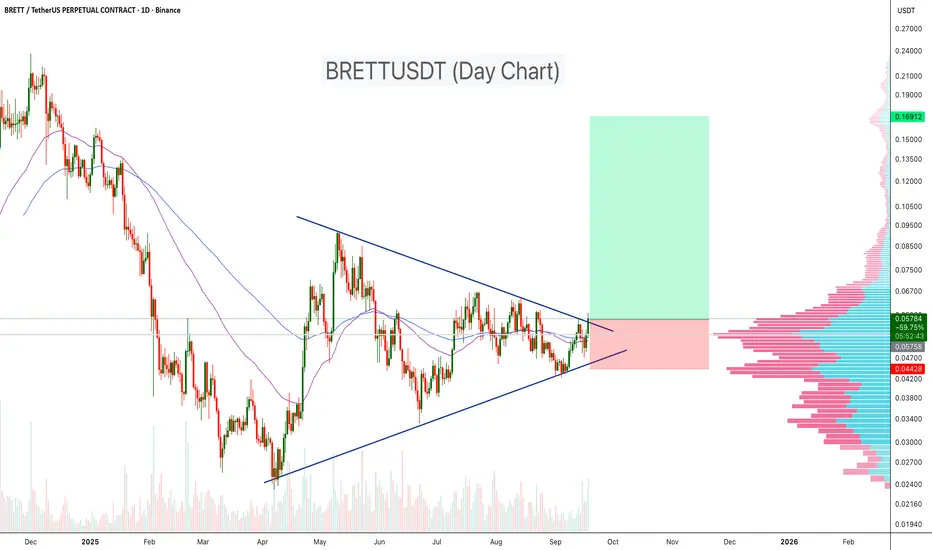
BRETTUSDT has been consolidating within a symmetrical triangle for several months, showing strong compression between ascending support and descending resistance. Recently, price action has started to break above the resistance trendline, signaling a possible bullish continuation. With moving averages turning supportive and volume profile showing a low-resistance zone above, this breakout could trigger a strong move higher.
Key Points:
- Pattern: Symmetrical triangle consolidation since April.
- Support: Strong base around 0.045 USDT (stop-loss zone).
- Resistance Breakout: Price breaking above 0.058 level.
- Volume Profile: Thin liquidity gap above, could accelerate upside.
- Target Zone: 100%-200% move in midterm
- Moving Averages: Price reclaiming 50 & 100 EMA, confirming bullish momentum.
Cheers
Hexa
🚀Telegram : t.me/hexatrades
🌐Website: hexatrades.io/
🗣️Twitter(X): twitter.com/HexaTrades
🌐Website: hexatrades.io/
🗣️Twitter(X): twitter.com/HexaTrades
関連の投稿
免責事項
これらの情報および投稿は、TradingViewが提供または保証する金融、投資、取引、またはその他の種類のアドバイスや推奨を意図したものではなく、またそのようなものでもありません。詳しくは利用規約をご覧ください。
🚀Telegram : t.me/hexatrades
🌐Website: hexatrades.io/
🗣️Twitter(X): twitter.com/HexaTrades
🌐Website: hexatrades.io/
🗣️Twitter(X): twitter.com/HexaTrades
関連の投稿
免責事項
これらの情報および投稿は、TradingViewが提供または保証する金融、投資、取引、またはその他の種類のアドバイスや推奨を意図したものではなく、またそのようなものでもありません。詳しくは利用規約をご覧ください。