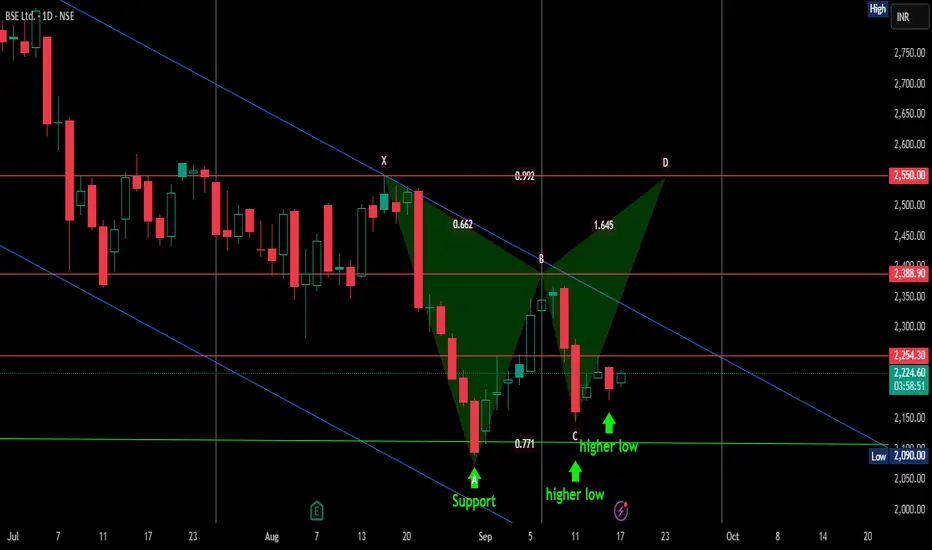
Here i would like to mention that BSE is gradually coming down in declining channel marked in blue color line. if you see now there is a formation of higher high and higher low and as per gann theory three days low BSE is not trying to break it's 3 days low.
so i am expecting that if it will break previous high which is marked in RED as resistance,whenever it ge break then might be break declining channel as well and will follow BAT PATTERN.
THIS IS JUST AN INFORMATION AND LEARNING TO ANALYSE NOT BYUY/SELL CALL.
so i am expecting that if it will break previous high which is marked in RED as resistance,whenever it ge break then might be break declining channel as well and will follow BAT PATTERN.
THIS IS JUST AN INFORMATION AND LEARNING TO ANALYSE NOT BYUY/SELL CALL.
免責事項
これらの情報および投稿は、TradingViewが提供または保証する金融、投資、取引、またはその他の種類のアドバイスや推奨を意図したものではなく、またそのようなものでもありません。詳しくは利用規約をご覧ください。
免責事項
これらの情報および投稿は、TradingViewが提供または保証する金融、投資、取引、またはその他の種類のアドバイスや推奨を意図したものではなく、またそのようなものでもありません。詳しくは利用規約をご覧ください。