Did you know that dominance is on the verge of collapsing in the coming days? Let me tell you why.
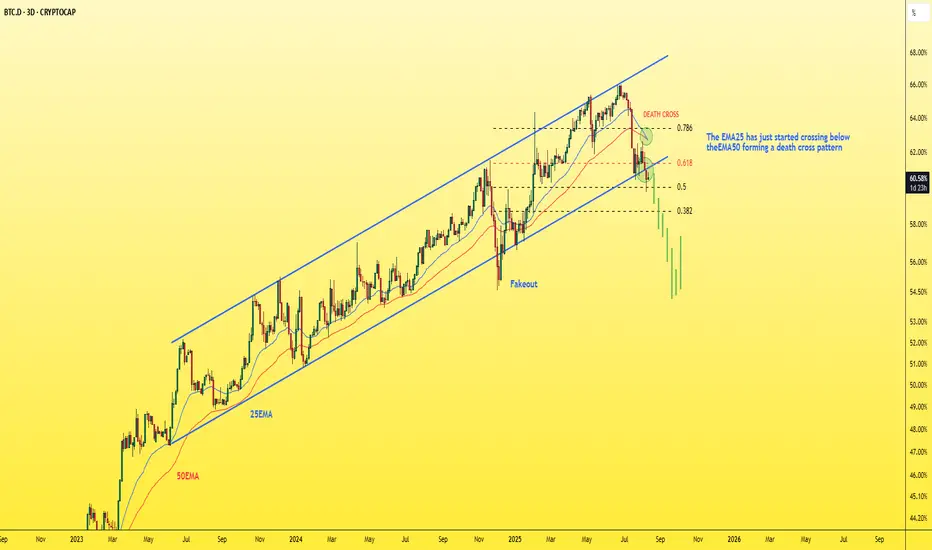
🔸On the 3-day dominance chart:
- We have the beginning of a break of the ascending channel, a close below it, and a retest.
- There’s also a break of an important support level at 0.618 Fibonacci, followed by a retest, and it’s currently trading below it.
- Plus, we have a death cross where the EMA25 crossed below the EMA50.
That’s three confirmations on one chart — can you imagine?
The coming days will likely see a strong pump in altcoins. Remember my words.
Best Regards:
Ceciliones🎯
🔻 free telegram channel🔻
t.me/itradeoncrypto
🎯contact us For VIP services🎯
t.me/Cecilion1
t.me/itradeoncrypto
🎯contact us For VIP services🎯
t.me/Cecilion1
免責事項
これらの情報および投稿は、TradingViewが提供または保証する金融、投資、取引、またはその他の種類のアドバイスや推奨を意図したものではなく、またそのようなものでもありません。詳しくは利用規約をご覧ください。
🔻 free telegram channel🔻
t.me/itradeoncrypto
🎯contact us For VIP services🎯
t.me/Cecilion1
t.me/itradeoncrypto
🎯contact us For VIP services🎯
t.me/Cecilion1
免責事項
これらの情報および投稿は、TradingViewが提供または保証する金融、投資、取引、またはその他の種類のアドバイスや推奨を意図したものではなく、またそのようなものでもありません。詳しくは利用規約をご覧ください。