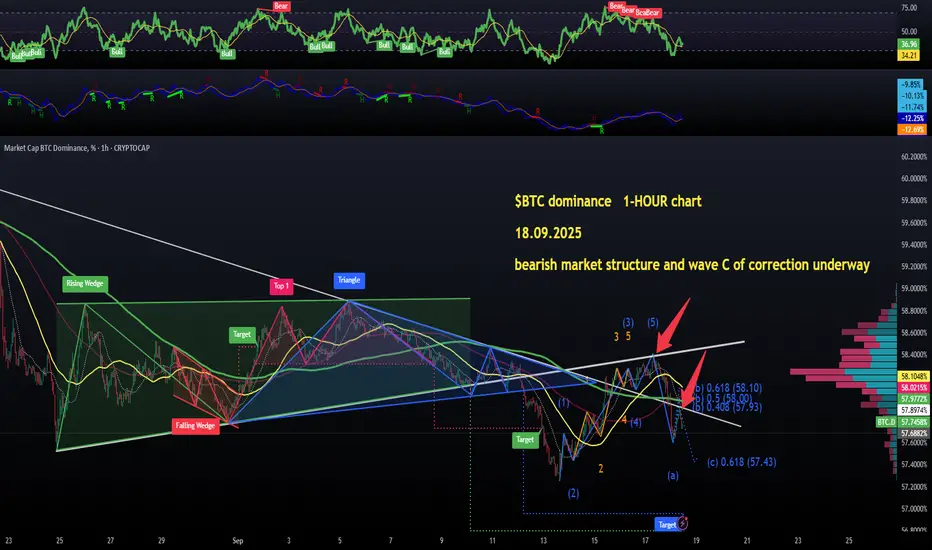
I highlighted a series of bear RSI divergences when the dominance was above 58.20% and these divergences have been playing out perfectly, predicting and end of the last wave up on the hourly chart.
Ascending resistance (lower trendline of the rising wedge that broke down on Sep 10) gave us a bearish retest from below and its's been a full-on correction here, currently in wave C targetting 57.43%.
That's why I have been in a few long positions immediately after the FOMC, which I did not plan, but the dominance chart dictates my moves💙👽
Also, it looks like in 40 days we are getting another 0.25% rate cut.
My thesis stays the same: great Q4 incoming.
免責事項
これらの情報および投稿は、TradingViewが提供または保証する金融、投資、取引、またはその他の種類のアドバイスや推奨を意図したものではなく、またそのようなものでもありません。詳しくは利用規約をご覧ください。
免責事項
これらの情報および投稿は、TradingViewが提供または保証する金融、投資、取引、またはその他の種類のアドバイスや推奨を意図したものではなく、またそのようなものでもありません。詳しくは利用規約をご覧ください。