TL;DR
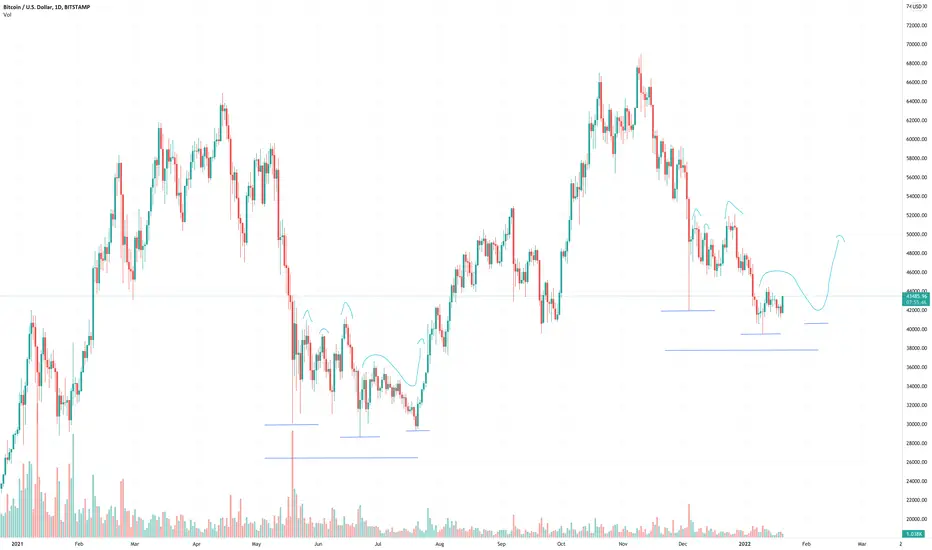
June/July of 2021 and December/January of 2022 have the following notable similarities:
- One big flash dip
- 3 mini peaks followed by a further dip (Bottom)
- Recovery and sideways action before *one final dip somewhere in between both of the lowest wicks*(still to come)
While looking far and wide for some hopium during the latest dip, I decided to check the daily charts from the crash in May/June/July and noticed some similarities between both.
By no means is this truly TA but similarities in both dips may cause them to play out in the same way - if that's the case, the worst is over and I'm anticipating a dip to $40.5k around the 7th-15th of February before a rally.
Will keep an eye on this and update as the days go on.
ノート
Lol免責事項
これらの情報および投稿は、TradingViewが提供または保証する金融、投資、取引、またはその他の種類のアドバイスや推奨を意図したものではなく、またそのようなものでもありません。詳しくは利用規約をご覧ください。
免責事項
これらの情報および投稿は、TradingViewが提供または保証する金融、投資、取引、またはその他の種類のアドバイスや推奨を意図したものではなく、またそのようなものでもありません。詳しくは利用規約をご覧ください。