Hey! I am back with another Technical Analysis, this time loooking at Bitcoin, Indicator for the whole Cryptocurrecy market.
Bitcoin Weekly chart is looking very good.
Why?
Here are my Points.
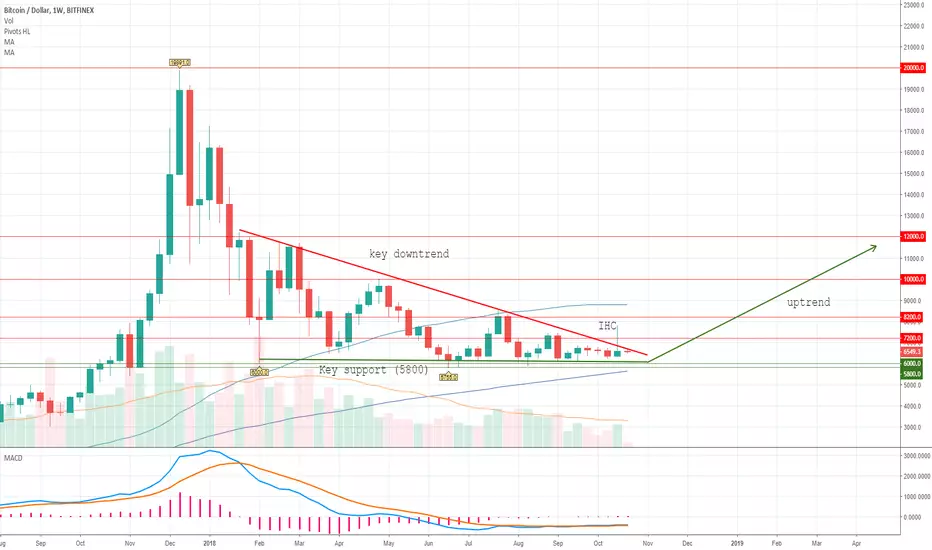
- Key Downtrend is about to be broken.
- Bitcoin have strong support around 5800-6000 area, this negates all of those 2014 comparisons, as there was no strong support.
- MACD indicates a that a new long MACD wave is rising.
-Inverted Hammer Candlestick(IHC) has formed, which acts as possible trend reversal signal.
- Both IXIC(NASDAQ) and DJI(DOW30) being very overpriced with bearish(weekly, 2weeks, monthly) Signal, possible money from a long downtrend markets may visit uptrend crypto market. (10 years uptrend with tiny corrections just inst healthy at all)
- Low volume. I ve read one funny idea saying Bitcoin is "ded" due to no Volume, but it means the opposite. Bitcoin has the see the lowest volume average, and from there the volume uptrend may begin.
- 100MA slowly headed into 5800-6000 support zone.
- People fear in investing into Crypto.
- Fundamentals of whole Crypto market are just even better than before the 20,000 breakout.
What I cannot predict, is what will happen after the downtrend gets broken, Breakout or just a uptrend?
Bitcoin doesnt have to see a Breakout. I think we are more likely to see a sideways uptrend, somehow same as the key downtrend looks like.
So long awaited uptrend is right behind the corner, after another long uptrend another Breakout of Bitcoin may begin, once again.
Its just another phase, of another Cycle.
Dont believe your emotions, believe proper Technical Analysis.
Thats all from me for now. If you agree with this Technical Analysis, consider leaving that "Agree Button" blue, as it leads me to post more similiar Technical Analysis.
Thanks for your time and good luck trading!
Bitcoin Weekly chart is looking very good.
Why?
Here are my Points.
- Key Downtrend is about to be broken.
- Bitcoin have strong support around 5800-6000 area, this negates all of those 2014 comparisons, as there was no strong support.
- MACD indicates a that a new long MACD wave is rising.
-Inverted Hammer Candlestick(IHC) has formed, which acts as possible trend reversal signal.
- Both IXIC(NASDAQ) and DJI(DOW30) being very overpriced with bearish(weekly, 2weeks, monthly) Signal, possible money from a long downtrend markets may visit uptrend crypto market. (10 years uptrend with tiny corrections just inst healthy at all)
- Low volume. I ve read one funny idea saying Bitcoin is "ded" due to no Volume, but it means the opposite. Bitcoin has the see the lowest volume average, and from there the volume uptrend may begin.
- 100MA slowly headed into 5800-6000 support zone.
- People fear in investing into Crypto.
- Fundamentals of whole Crypto market are just even better than before the 20,000 breakout.
What I cannot predict, is what will happen after the downtrend gets broken, Breakout or just a uptrend?
Bitcoin doesnt have to see a Breakout. I think we are more likely to see a sideways uptrend, somehow same as the key downtrend looks like.
So long awaited uptrend is right behind the corner, after another long uptrend another Breakout of Bitcoin may begin, once again.
Its just another phase, of another Cycle.
Dont believe your emotions, believe proper Technical Analysis.
Thats all from me for now. If you agree with this Technical Analysis, consider leaving that "Agree Button" blue, as it leads me to post more similiar Technical Analysis.
Thanks for your time and good luck trading!
ノート
ノート
ノート
免責事項
これらの情報および投稿は、TradingViewが提供または保証する金融、投資、取引、またはその他の種類のアドバイスや推奨を意図したものではなく、またそのようなものでもありません。詳しくは利用規約をご覧ください。
免責事項
これらの情報および投稿は、TradingViewが提供または保証する金融、投資、取引、またはその他の種類のアドバイスや推奨を意図したものではなく、またそのようなものでもありません。詳しくは利用規約をご覧ください。