🔰 Trend Matrix + RSI: Simple Multi‑Timeframe Strategy for Confident Trades 🚀
Want a strategy that’s easy for beginners yet powerful enough for pros? This TradingView idea combines the Trend Matrix Multi-Timeframe Dashboard with the classic RSI indicator to create a visually compelling, high-probability trading method. By aligning multi-timeframe trend signals with momentum confirmation, you get clear guidance on when to enter and exit trades on any market – from Bitcoin and Gold to Nifty 50. 📈✨
Strategy Overview 🎯
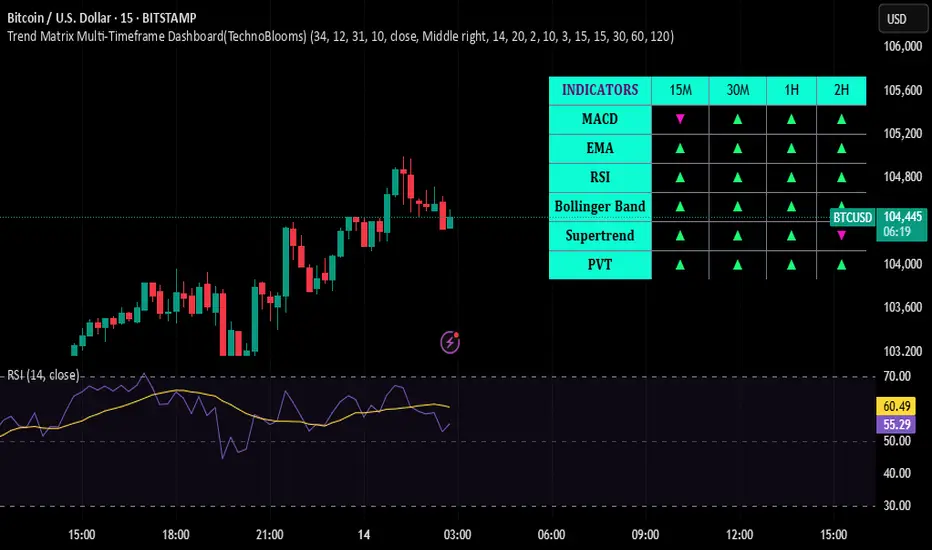
• Trend Matrix MTF Dashboard: This is a multi-timeframe trend analyzer that compresses several trusted indicators into one simple dashboard . It displays a grid of up/down arrows showing the trend signal from multiple indicators (like MACD, EMA, RSI, Bollinger Bands, Supertrend, PVT) across different timeframes . If most arrows are green (up), the market’s trend is bullish; if mostly red (down), it’s bearish. Think of it as a “trend at a glance” panel – a quick green-light/red-light system that helps you trade with confidence by filtering out noise . It’s designed to be clean and beginner-friendly (no messy charts!) , so you can instantly gauge the dominant trend without flipping through multiple timeframes.
• RSI (Relative Strength Index): RSI measures momentum and identifies overbought/oversold conditions. It’s a favorite tool for confirming entries: when RSI is low (oversold) in an uptrend, it suggests a good buy the dip opportunity; when RSI is high (overbought) in a downtrend, it suggests a good sell the rally spot . RSI also has a midpoint at 50 – above 50 generally indicates bullish momentum, below 50 indicates bearish momentum. By combining RSI with the Trend Matrix, we add an extra layer of confirmation so we’re not just blindly following trend signals – we’re waiting for momentum to agree with the trend direction.
Why this combo? The Trend Matrix gives you the big picture trend alignment (across 1H, 15M, etc.) while RSI pinpoints timing for entries. This way, you trade with the larger trend but only enter when momentum swings in your favor. The result is a simple strategy that catches strong moves and avoids false signals. This works best in trending markets (when the Trend Matrix shows a clear majority direction) – that’s when our trend+momentum combo shines. In choppy/ranging markets (mixed signals on the dashboard), it’s wise to be patient or use tighter confirmation (e.g. require an extra indicator or higher RSI threshold) because signals can flip-flop in ranges. Always remember: no indicator is 100%, but combining them stacks the odds in our favor by aligning trend and momentum. 💪
Entry & Exit Rules 📌
Timeframes: Higher timeframe: 1H (for trend direction) – Lower timeframe: 15M (for entries). We use 1H Trend Matrix to define the context, and 15M with RSI for execution. (You can adapt to other pairs like 4H/1H for swing trades or 15M/5M for scalping, but 1H/15M is a universal starting point that works for crypto, commodities, and indices.)
1️⃣ Identify the Trend (1H Chart): Check the Trend Matrix dashboard on the 1H timeframe for the asset you’re trading (e.g., BTC/USD, XAUUSD, NIFTY). If the majority of signals on 1H are up (mostly green arrows), your bias is LONG. If the majority are down (mostly red arrows), your bias is SHORT. No clear majority? The market might be sideways – consider waiting. 👍
2️⃣ Align Lower Timeframe (15M Chart): Switch to the 15M chart. Ensure the 15M Trend Matrix is at least mostly aligned in the same direction as the 1H. You want to see that the short-term trend is not fighting the higher timeframe. This keeps you trading in the direction of the dominant trend, avoiding counter-trend traps  .
3️⃣ RSI Confirmation for Entry: Now use RSI on the 15M chart to time your entry:
• For a Long Trade: Wait for RSI to dip into an oversold zone (below ~30) during that uptrend. An oversold reading in a bullish-trending market means price pulled back against the trend – a potential entry point. Enter long when RSI starts rising back up (e.g., crosses above 30 or 40 from below) and the Trend Matrix still shows bullish alignment. Another method: if RSI was below 50 and then pushes back above 50, it signals momentum is regaining in the upward direction . This is your green light to buy.
• For a Short Trade: Wait for RSI to spike into an overbought zone (above ~70) during that downtrend. Overbought in a bearish trend = a bounce that could reverse down. Enter short when RSI turns down from high levels (e.g., drops below 70 or 60) and the Trend Matrix still shows bearish alignment. Alternatively, an RSI cross from above 50 downwards back below 50 can confirm momentum turning down with the trend .
✨ The idea is to buy dips in an uptrend and sell rips in a downtrend. RSI is your trigger to make sure you’re entering when momentum is resetting in your favor, rather than chasing an already overextended move.
4️⃣ Exiting the Trade: Set clear exit rules to lock in profit and limit risk:
• Take Profit/Exit on Momentum Extremes: In a long, consider taking profit when RSI reaches back into overbought (>70) on the 15M or shows a bearish divergence (signs of trend exhaustion). In a short, take profit when RSI goes oversold (<30) or shows bullish divergence. This way, you exit as the move reaches the opposite extreme of momentum.
• Dashboard Trend Reversal: If the Trend Matrix starts to flip signals against your trade (e.g., you were long and you see several key cells turn from green to red on the 15M or 1H dashboard), that warns the trend may be weakening. You could exit if 4-5 or more of the 15M signals turn opposite or if the 1H majority is no longer aligned . For example, if you’re long and the dashboard goes from mostly green to half red, it’s time to secure profits or tighten your stop.
• Stop Loss: Always use a stop! A common approach is placing a stop-loss below the recent swing low (for longs) or above the recent swing high (for shorts) on the 15M chart. If price hits this, it means the setup failed and you exit the trade to prevent larger losses. 🔒
By following these entry/exit rules, you’ll ride the trend when both the trend structure (Trend Matrix) and momentum (RSI) agree, and step aside when they don’t.
Tips for Beginners 💡
• Stick to Clear Trends: This strategy shines in clear uptrends or downtrends. If the Trend Matrix panel is mixed (some green, some red), the market may be choppy – be patient or skip trading until a direction emerges. 🔃
• Use 1H/15M as a Starting Point: For versatility, start with 1H trend and 15M entries, which works well for intraday and short swing trades on BTC, Gold, Nifty, etc. Once comfortable, you can experiment with other timeframe pairs (e.g., 4H/1H for longer swings, or 15M/5M for faster scalps).
• Don’t Ignore Risk Management: Even the best strategy can have losses. Always set a stop-loss and manage your trade size. For example, if the dashboard and RSI setup looks perfect, still only risk a small percentage of your capital on the trade. Risk management is key to long-term success. 📉🔒
• Practice and Review: Try this combo out on historical data or a demo account first. Observe how often the signals would have worked and how you might fine-tune entry timing. With practice, you’ll get a feel for how the Trend Matrix and RSI interact. 📝✅
• Stay Emotionally Disciplined: The dashboard gives a quick green/red view, and RSI adds confidence, but avoid taking trades out of FOMO if the criteria aren’t met. It’s okay to miss a move – there will always be another opportunity. Keep a cool head and stick to the rules. 👍
By following this beginner-friendly game plan, you’ll be leveraging a powerful multi-timeframe edge. The Trend Matrix + RSI combo helps ensure you trade with the trend and with momentum on your side – a recipe for more confident and higher-probability trades. Good luck and happy trading! 🍀🚀
#BTCUSD #XAUUSD #NIFTY50 #TrendMatrix #RSI #TradingStrategy #MultiTimeframe #DayTrading #SwingTrading #TechnoBlooms #Beginners
Want a strategy that’s easy for beginners yet powerful enough for pros? This TradingView idea combines the Trend Matrix Multi-Timeframe Dashboard with the classic RSI indicator to create a visually compelling, high-probability trading method. By aligning multi-timeframe trend signals with momentum confirmation, you get clear guidance on when to enter and exit trades on any market – from Bitcoin and Gold to Nifty 50. 📈✨
Strategy Overview 🎯
• Trend Matrix MTF Dashboard: This is a multi-timeframe trend analyzer that compresses several trusted indicators into one simple dashboard . It displays a grid of up/down arrows showing the trend signal from multiple indicators (like MACD, EMA, RSI, Bollinger Bands, Supertrend, PVT) across different timeframes . If most arrows are green (up), the market’s trend is bullish; if mostly red (down), it’s bearish. Think of it as a “trend at a glance” panel – a quick green-light/red-light system that helps you trade with confidence by filtering out noise . It’s designed to be clean and beginner-friendly (no messy charts!) , so you can instantly gauge the dominant trend without flipping through multiple timeframes.
• RSI (Relative Strength Index): RSI measures momentum and identifies overbought/oversold conditions. It’s a favorite tool for confirming entries: when RSI is low (oversold) in an uptrend, it suggests a good buy the dip opportunity; when RSI is high (overbought) in a downtrend, it suggests a good sell the rally spot . RSI also has a midpoint at 50 – above 50 generally indicates bullish momentum, below 50 indicates bearish momentum. By combining RSI with the Trend Matrix, we add an extra layer of confirmation so we’re not just blindly following trend signals – we’re waiting for momentum to agree with the trend direction.
Why this combo? The Trend Matrix gives you the big picture trend alignment (across 1H, 15M, etc.) while RSI pinpoints timing for entries. This way, you trade with the larger trend but only enter when momentum swings in your favor. The result is a simple strategy that catches strong moves and avoids false signals. This works best in trending markets (when the Trend Matrix shows a clear majority direction) – that’s when our trend+momentum combo shines. In choppy/ranging markets (mixed signals on the dashboard), it’s wise to be patient or use tighter confirmation (e.g. require an extra indicator or higher RSI threshold) because signals can flip-flop in ranges. Always remember: no indicator is 100%, but combining them stacks the odds in our favor by aligning trend and momentum. 💪
Entry & Exit Rules 📌
Timeframes: Higher timeframe: 1H (for trend direction) – Lower timeframe: 15M (for entries). We use 1H Trend Matrix to define the context, and 15M with RSI for execution. (You can adapt to other pairs like 4H/1H for swing trades or 15M/5M for scalping, but 1H/15M is a universal starting point that works for crypto, commodities, and indices.)
1️⃣ Identify the Trend (1H Chart): Check the Trend Matrix dashboard on the 1H timeframe for the asset you’re trading (e.g., BTC/USD, XAUUSD, NIFTY). If the majority of signals on 1H are up (mostly green arrows), your bias is LONG. If the majority are down (mostly red arrows), your bias is SHORT. No clear majority? The market might be sideways – consider waiting. 👍
2️⃣ Align Lower Timeframe (15M Chart): Switch to the 15M chart. Ensure the 15M Trend Matrix is at least mostly aligned in the same direction as the 1H. You want to see that the short-term trend is not fighting the higher timeframe. This keeps you trading in the direction of the dominant trend, avoiding counter-trend traps  .
3️⃣ RSI Confirmation for Entry: Now use RSI on the 15M chart to time your entry:
• For a Long Trade: Wait for RSI to dip into an oversold zone (below ~30) during that uptrend. An oversold reading in a bullish-trending market means price pulled back against the trend – a potential entry point. Enter long when RSI starts rising back up (e.g., crosses above 30 or 40 from below) and the Trend Matrix still shows bullish alignment. Another method: if RSI was below 50 and then pushes back above 50, it signals momentum is regaining in the upward direction . This is your green light to buy.
• For a Short Trade: Wait for RSI to spike into an overbought zone (above ~70) during that downtrend. Overbought in a bearish trend = a bounce that could reverse down. Enter short when RSI turns down from high levels (e.g., drops below 70 or 60) and the Trend Matrix still shows bearish alignment. Alternatively, an RSI cross from above 50 downwards back below 50 can confirm momentum turning down with the trend .
✨ The idea is to buy dips in an uptrend and sell rips in a downtrend. RSI is your trigger to make sure you’re entering when momentum is resetting in your favor, rather than chasing an already overextended move.
4️⃣ Exiting the Trade: Set clear exit rules to lock in profit and limit risk:
• Take Profit/Exit on Momentum Extremes: In a long, consider taking profit when RSI reaches back into overbought (>70) on the 15M or shows a bearish divergence (signs of trend exhaustion). In a short, take profit when RSI goes oversold (<30) or shows bullish divergence. This way, you exit as the move reaches the opposite extreme of momentum.
• Dashboard Trend Reversal: If the Trend Matrix starts to flip signals against your trade (e.g., you were long and you see several key cells turn from green to red on the 15M or 1H dashboard), that warns the trend may be weakening. You could exit if 4-5 or more of the 15M signals turn opposite or if the 1H majority is no longer aligned . For example, if you’re long and the dashboard goes from mostly green to half red, it’s time to secure profits or tighten your stop.
• Stop Loss: Always use a stop! A common approach is placing a stop-loss below the recent swing low (for longs) or above the recent swing high (for shorts) on the 15M chart. If price hits this, it means the setup failed and you exit the trade to prevent larger losses. 🔒
By following these entry/exit rules, you’ll ride the trend when both the trend structure (Trend Matrix) and momentum (RSI) agree, and step aside when they don’t.
Tips for Beginners 💡
• Stick to Clear Trends: This strategy shines in clear uptrends or downtrends. If the Trend Matrix panel is mixed (some green, some red), the market may be choppy – be patient or skip trading until a direction emerges. 🔃
• Use 1H/15M as a Starting Point: For versatility, start with 1H trend and 15M entries, which works well for intraday and short swing trades on BTC, Gold, Nifty, etc. Once comfortable, you can experiment with other timeframe pairs (e.g., 4H/1H for longer swings, or 15M/5M for faster scalps).
• Don’t Ignore Risk Management: Even the best strategy can have losses. Always set a stop-loss and manage your trade size. For example, if the dashboard and RSI setup looks perfect, still only risk a small percentage of your capital on the trade. Risk management is key to long-term success. 📉🔒
• Practice and Review: Try this combo out on historical data or a demo account first. Observe how often the signals would have worked and how you might fine-tune entry timing. With practice, you’ll get a feel for how the Trend Matrix and RSI interact. 📝✅
• Stay Emotionally Disciplined: The dashboard gives a quick green/red view, and RSI adds confidence, but avoid taking trades out of FOMO if the criteria aren’t met. It’s okay to miss a move – there will always be another opportunity. Keep a cool head and stick to the rules. 👍
By following this beginner-friendly game plan, you’ll be leveraging a powerful multi-timeframe edge. The Trend Matrix + RSI combo helps ensure you trade with the trend and with momentum on your side – a recipe for more confident and higher-probability trades. Good luck and happy trading! 🍀🚀
#BTCUSD #XAUUSD #NIFTY50 #TrendMatrix #RSI #TradingStrategy #MultiTimeframe #DayTrading #SwingTrading #TechnoBlooms #Beginners
免責事項
これらの情報および投稿は、TradingViewが提供または保証する金融、投資、取引、またはその他の種類のアドバイスや推奨を意図したものではなく、またそのようなものでもありません。詳しくは利用規約をご覧ください。
免責事項
これらの情報および投稿は、TradingViewが提供または保証する金融、投資、取引、またはその他の種類のアドバイスや推奨を意図したものではなく、またそのようなものでもありません。詳しくは利用規約をご覧ください。