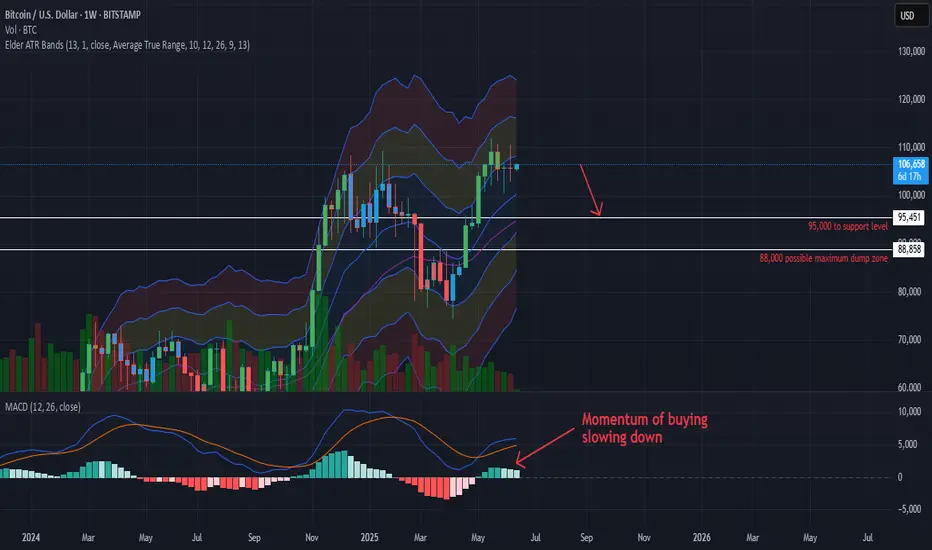
BTC’s weekly MACD is showing warning signs while price coiled under key resistance—setting the stage for a potential pullback.
Pullback to 95K
A bearish MACD crossover plus break of trend support could lead to $95K and possibly further to $88K–$90K.
But a strong breakout above $112K would shift momentum back sharply bullish.
Then by September / October in the fourth quarter, positive momentum comes back.
Pullback to 95K
A bearish MACD crossover plus break of trend support could lead to $95K and possibly further to $88K–$90K.
But a strong breakout above $112K would shift momentum back sharply bullish.
Then by September / October in the fourth quarter, positive momentum comes back.
免責事項
これらの情報および投稿は、TradingViewが提供または保証する金融、投資、取引、またはその他の種類のアドバイスや推奨を意図したものではなく、またそのようなものでもありません。詳しくは利用規約をご覧ください。
免責事項
これらの情報および投稿は、TradingViewが提供または保証する金融、投資、取引、またはその他の種類のアドバイスや推奨を意図したものではなく、またそのようなものでもありません。詳しくは利用規約をご覧ください。