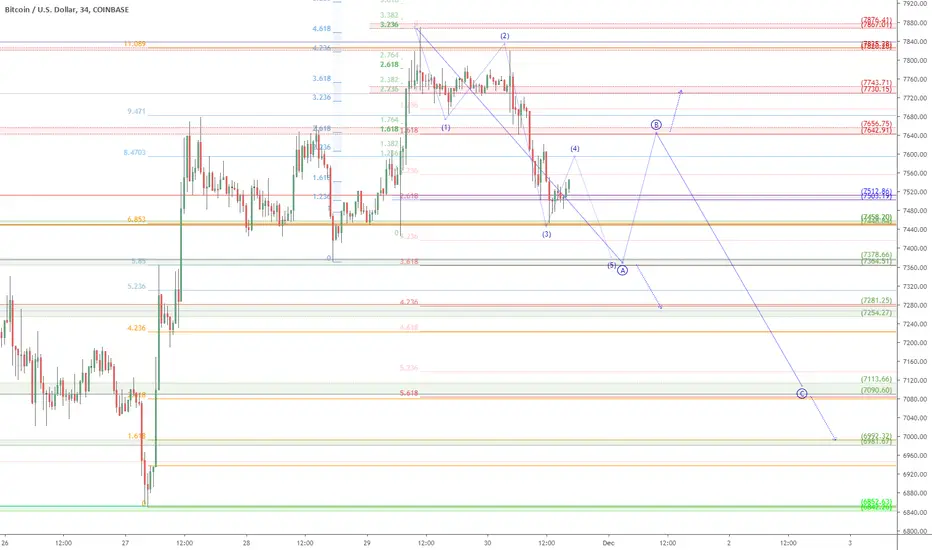
Followup to my bigger picture plot posted here (click).
Retrace started exactly where it was "supposed" to (see above link).
The pullback appears to be significant and possibly a big correction.
Question of which wave is retracing (last small one or entire bounce).
An alternate view would be to consider retrace done.
If and when such signs appear, I will try to post as such.
But the exact turn was predicted thus my faith in this one.
$ 7503 - 7513 (blue) is the KEY zone to to confirm or deny the paths.
$ 7642 - 7656 (red) should be pretty strong resistance if retrace is real.
$ 7730 - 7745 (red) is the maximum expected, or the plot is invalid.
Part of my ongoing Bitcoin analysis, been hitting every important turn (click):
7860 Retrace Call
7650 Resistance Map
6850 Bounce plot
5882 critical number
8700 Top Call
21k possible target (still possible)
9k bounce call
14k target call <=Perfect TP
10k target call
7.5k bounce call
3.1k bottom call (EXACT 2018 bottom)
Of course, I have had total FAILS on some ideas too, not going to pretend.
But all of my plots show PRECISE entries, TIGHT stops, and EXACT targets.
Precision is the way of the Fib. Almost every turn happens at a Fib Line.
.
ノート
Support seems to be holding a little better than the last one So adjusting the EW positions from original plot:
And we have two significant resistances before we even get to that round number...
But wave B's (if get a real one) can be surprising, they start with shorts taking profit, then bulls jump in, until more shorts take profit, etc.
It is also possible (but not likely imo) that correction is done, we consolidate here for a while, then resume uptrend.
If correction is done, we should see "impulsive" waves upwards next...
.
the Golden Ratio is my Religion
the Trading View is my Nation
the Moderator Tag is my Flag
the Trading View is my Nation
the Moderator Tag is my Flag
関連の投稿
免責事項
これらの情報および投稿は、TradingViewが提供または保証する金融、投資、取引、またはその他の種類のアドバイスや推奨を意図したものではなく、またそのようなものでもありません。詳しくは利用規約をご覧ください。
the Golden Ratio is my Religion
the Trading View is my Nation
the Moderator Tag is my Flag
the Trading View is my Nation
the Moderator Tag is my Flag
関連の投稿
免責事項
これらの情報および投稿は、TradingViewが提供または保証する金融、投資、取引、またはその他の種類のアドバイスや推奨を意図したものではなく、またそのようなものでもありません。詳しくは利用規約をご覧ください。
