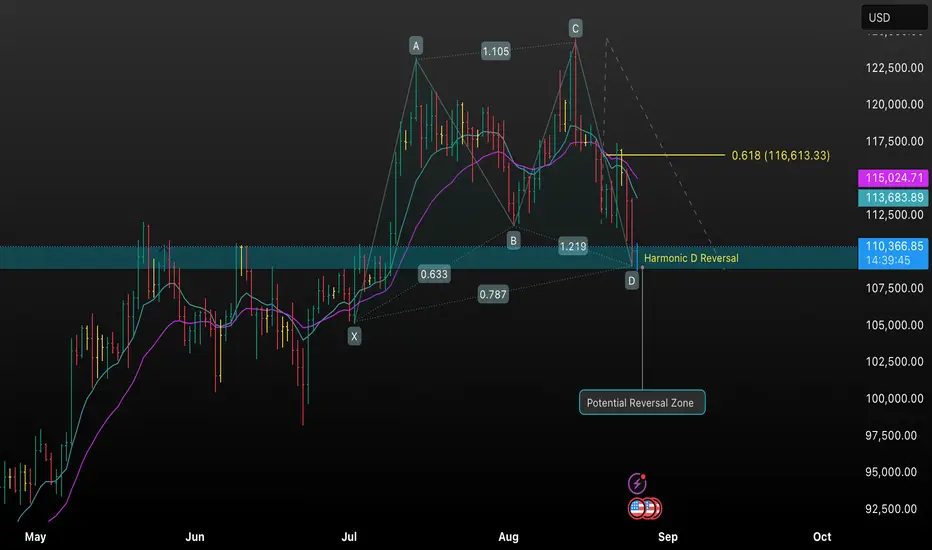
This TradingView chart analyzes Bitcoin (BTCUSD) using a harmonic pattern approach, illustrating the price pathway through significant XABCD points. The “Potential Reversal Zone” (PRZ) and Harmonic D completion area suggest a possible bullish reversal. Key Fibonacci retracement levels, moving averages, and support-resistance zones inform the analysis, providing actionable insights for swing traders and technical analy
免責事項
この情報および投稿は、TradingViewが提供または推奨する金融、投資、トレード、その他のアドバイスや推奨を意図するものではなく、それらを構成するものでもありません。詳細は利用規約をご覧ください。
免責事項
この情報および投稿は、TradingViewが提供または推奨する金融、投資、トレード、その他のアドバイスや推奨を意図するものではなく、それらを構成するものでもありません。詳細は利用規約をご覧ください。