Ha! I kid, I kid. There is no holy grail indicator.
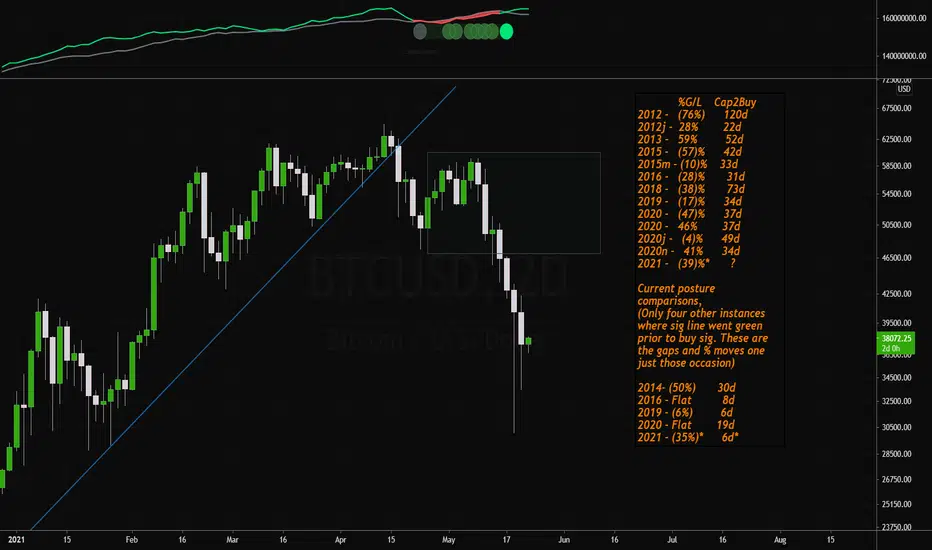
In this post, I dive deep into the deets on the hash ribbon indicator and want to share my results. The box drawn on the chart is plotting the average resolution time. Also the percent moves are maximum moves, peak to trough and vice versa. The rest should be detailed enough.
Legend:
G/L = gain/loss
Cap2Buy = The time between capitulation signal and the buy signal.
...d = Days. ie, 304d is 304 days.
...d* = Same as above but is up to date data and will change in the future with more data.
Happy trading and feel free to ask me any questions!
ノート
Check me out at No Noiz on YT for live shows as well!免責事項
これらの情報および投稿は、TradingViewが提供または保証する金融、投資、取引、またはその他の種類のアドバイスや推奨を意図したものではなく、またそのようなものでもありません。詳しくは利用規約をご覧ください。
免責事項
これらの情報および投稿は、TradingViewが提供または保証する金融、投資、取引、またはその他の種類のアドバイスや推奨を意図したものではなく、またそのようなものでもありません。詳しくは利用規約をご覧ください。