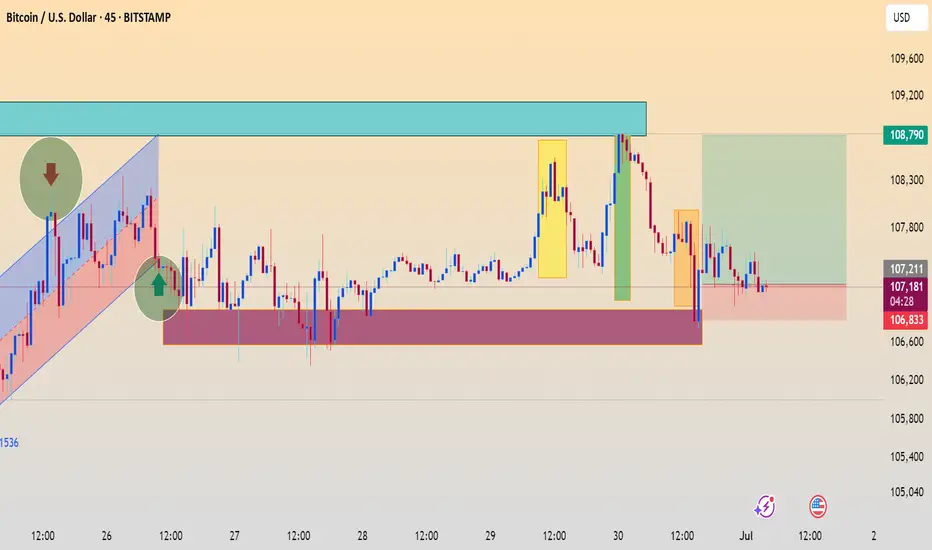
This chart shows Bitcoin (BTC/USD) on a 45-minute timeframe, with several key technical analysis elements marked:
Key Observations:
1. Trend Channel (Left side in red and blue):
The price was moving within a rising channel (bullish trend).
A breakout to the downside occurred, signaling a possible trend reversal.
2. Support Zone (Red shaded area):
Around the 106,600 to 107,200 range.
Price has tested this zone multiple times, showing strong demand/support.
3. Resistance Zone (Blue shaded area):
Roughly between 108,600 to 109,200.
Price was rejected from this area twice, showing significant selling pressure.
4. Highlighted Zones:
Green Rectangle: Successful bounce from the support area leading to a strong move upward.
Yellow Boxes: Impulsive bullish candles, signaling strong buying momentum.
Orange Box (Right): Bearish engulfing move, potentially showing exhaustion of bullish momentum.
Green and Red Arrows: Likely entry and exit signals.
Green arrow: Bullish entry at support.
Red arrow: Bearish entry at resistance.
5. Trade Setup:
A recent long position appears to have been initiated from the support zone, with a target near the upper resistance at 108,790.
The stop-loss seems to be below the support at around 106,833, and the entry around 107,122.
Summary:
The chart highlights a range-bound structure between the marked support and resistance zones.
A potential long trade is underway, targeting the upper resistance area.
Current price action is consolidating near support. A breakdown may invalidate the long setup, while a bounce could confirm a bullish move toward the 108,790 target.
Let me know if you’d like help calculating risk/reward or identifying the pattern names involved here.
免責事項
これらの情報および投稿は、TradingViewが提供または保証する金融、投資、取引、またはその他の種類のアドバイスや推奨を意図したものではなく、またそのようなものでもありません。詳しくは利用規約をご覧ください。
免責事項
これらの情報および投稿は、TradingViewが提供または保証する金融、投資、取引、またはその他の種類のアドバイスや推奨を意図したものではなく、またそのようなものでもありません。詳しくは利用規約をご覧ください。