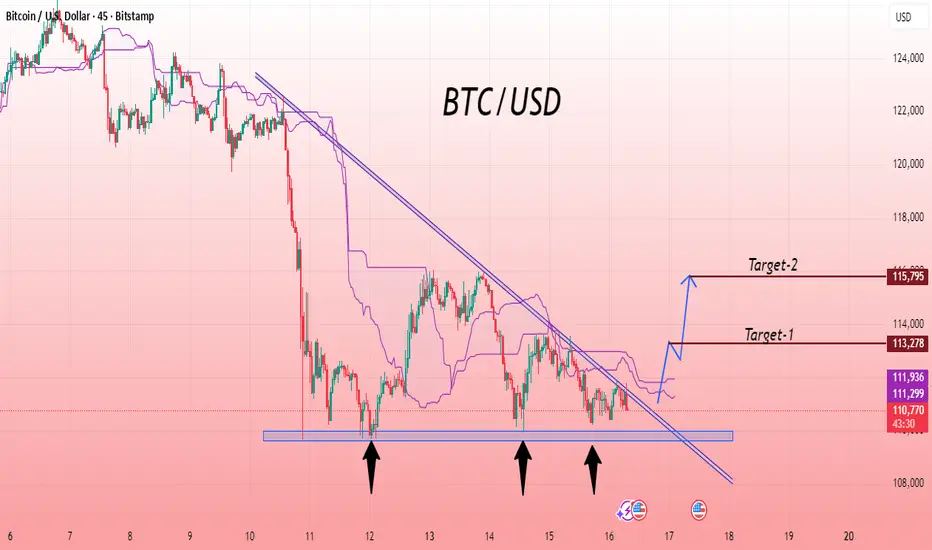
The Bitcoin/USD chart illustrates a strong accumulation phase forming near a significant support area, shown by multiple rebounds marked with arrows. Each retest of this zone demonstrates that buyers are actively defending the level, preventing further downside movement. A clear descending trendline reveals consistent selling pressure; however, recent candles indicate that bearish momentum is losing strength. This repeated defense at the bottom suggests growing buyer interest and potential preparation for a bullish reversal. If price manages to close above the descending line, it may confirm a shift in market sentiment from selling to buying. Overall, the chart reflects stabilization after a prolonged decline, with increasing signs that buyers are gradually regaining control over the market direction.
Entry Zone: Buy
🎯 Target 1 : 113,270
🎯 Target 2 : 115,795
If you found this analysis helpful, don’t forget to drop a like and comment. Your support keeps quality ideas flowing—let’s grow and win together! 💪📈
Entry Zone: Buy
🎯 Target 1 : 113,270
🎯 Target 2 : 115,795
If you found this analysis helpful, don’t forget to drop a like and comment. Your support keeps quality ideas flowing—let’s grow and win together! 💪📈
トレード稼働中
免責事項
この情報および投稿は、TradingViewが提供または推奨する金融、投資、トレード、その他のアドバイスや推奨を意図するものではなく、それらを構成するものでもありません。詳細は利用規約をご覧ください。
免責事項
この情報および投稿は、TradingViewが提供または推奨する金融、投資、トレード、その他のアドバイスや推奨を意図するものではなく、それらを構成するものでもありません。詳細は利用規約をご覧ください。