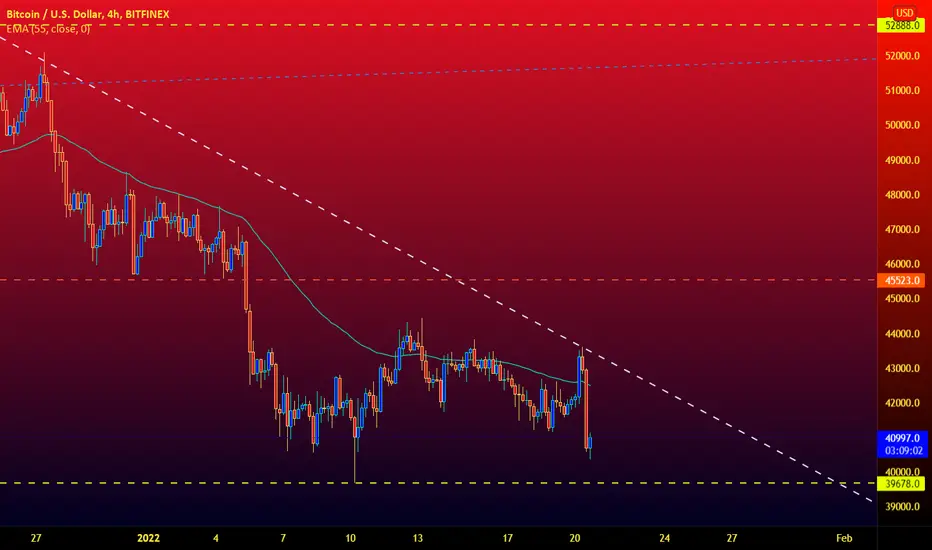
When looking at BTC on the 4hr TF we can see that it is approaching the end of the triangle shown. Every line shown is a major S/R zone. Let us watch and see which line will get broken first. If the diagonal line is broken, that will be a bullish sign and if the yellow line below is broken that will be a bearish sign. Whichever break, let's wait for a retest and a continuation in the same direction or the break, to confirm a bullish or bearish move.
Don't trade with what you're not willing to lose. Safe Trading, Calculate Your Risk/Reward & Collect!
Love it or hate it, hit that thumbs up and share your thoughts!
This is not financial advice. This is for educational purposes only.
Don't trade with what you're not willing to lose. Safe Trading, Calculate Your Risk/Reward & Collect!
Love it or hate it, hit that thumbs up and share your thoughts!
This is not financial advice. This is for educational purposes only.
免責事項
この情報および投稿は、TradingViewが提供または推奨する金融、投資、トレード、その他のアドバイスや推奨を意図するものではなく、それらを構成するものでもありません。詳細は利用規約をご覧ください。
免責事項
この情報および投稿は、TradingViewが提供または推奨する金融、投資、トレード、その他のアドバイスや推奨を意図するものではなく、それらを構成するものでもありません。詳細は利用規約をご覧ください。