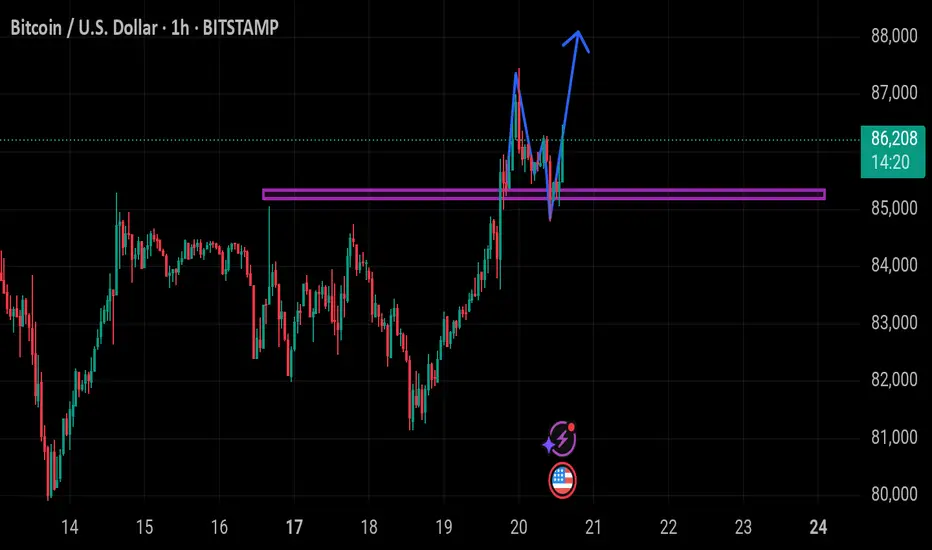
This is a Bitcoin (BTC/USD) price chart on the 1-hour timeframe from TradingView. The price is currently at $86,278, down -0.68%.
Key Observations:
1. Support Zone (Purple Line): A strong horizontal support/resistance level is drawn around $85,000.
2. Breakout & Retest: The price recently broke above this support zone, retested it, and bounced back up.
3. Bullish Projection (Blue Arrow): A potential bullish move is indicated, suggesting further upside momentum.
This chart suggests a possible continuation of the uptrend if the support holds. Let me know if you need further analysis!
免責事項
これらの情報および投稿は、TradingViewが提供または保証する金融、投資、取引、またはその他の種類のアドバイスや推奨を意図したものではなく、またそのようなものでもありません。詳しくは利用規約をご覧ください。
免責事項
これらの情報および投稿は、TradingViewが提供または保証する金融、投資、取引、またはその他の種類のアドバイスや推奨を意図したものではなく、またそのようなものでもありません。詳しくは利用規約をご覧ください。