There’s been a number of messages today informing me of the lower time frame head and shoulders pattern.
Traders are sometimes caught out with falsely identified head and shoulders patterns, and then the market runs in the opposite direction of that expected as the error is realised causing a energetic surge in price action as traders closes short positions.
How do you identify valid from void?
The last lower time frame (12hr examples used here) head and shoulders pattern printed in March 2022. There was a couple of leading indications this neckline would confirm as resistance at the time of the breakout:
1) RSI confirmed failed support (black circle)
2) Stochastic RSI is crossing down 80. Very bearish.
12hr head and shoulder March 2022

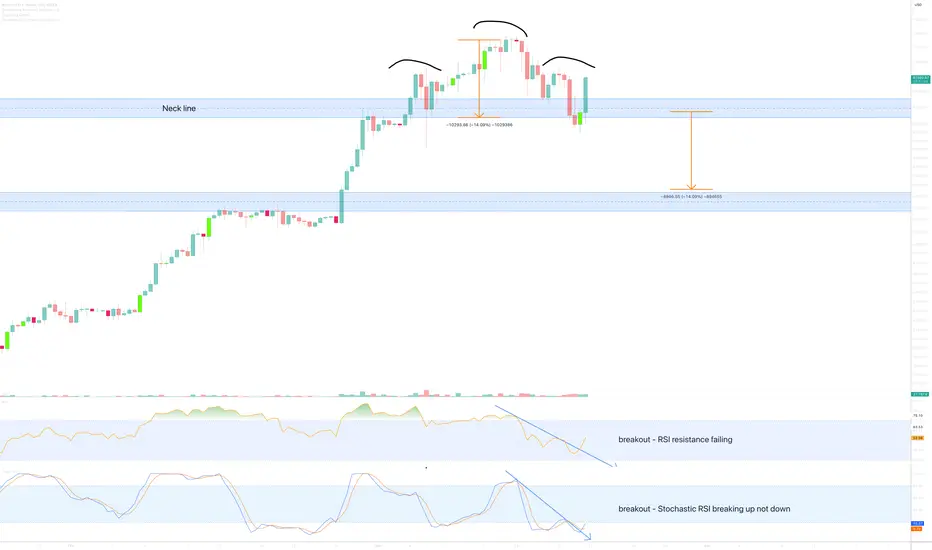
Now lets look above on the current 12hr chart (main chart)
1) RSI resistance is failing, a breakout is evident.
2) Stochastic RSI is crossing up not down! Very bullish.
There you have it. While many traders identify the price action of a head and shoulders pattern in isolation it is an expensive error to ignore what the oscillators are doing at the time of the print.
In almost all of the ideas published by Without Worries, if you look udder the main chart idea you’ll notice “Oscillators” as one of the selected indicators for use in the study. Now you know why!
Ww
Traders are sometimes caught out with falsely identified head and shoulders patterns, and then the market runs in the opposite direction of that expected as the error is realised causing a energetic surge in price action as traders closes short positions.
How do you identify valid from void?
The last lower time frame (12hr examples used here) head and shoulders pattern printed in March 2022. There was a couple of leading indications this neckline would confirm as resistance at the time of the breakout:
1) RSI confirmed failed support (black circle)
2) Stochastic RSI is crossing down 80. Very bearish.
12hr head and shoulder March 2022
Now lets look above on the current 12hr chart (main chart)
1) RSI resistance is failing, a breakout is evident.
2) Stochastic RSI is crossing up not down! Very bullish.
There you have it. While many traders identify the price action of a head and shoulders pattern in isolation it is an expensive error to ignore what the oscillators are doing at the time of the print.
In almost all of the ideas published by Without Worries, if you look udder the main chart idea you’ll notice “Oscillators” as one of the selected indicators for use in the study. Now you know why!
Ww
ノート
A lot of "shorts" were liquidated in the last 24hrs.80% short interest across exchanges at this moment.
How are they getting it wrong?
1) They're not following this post.
2) Oscillators were informing us momentum was rotating upwards at 62k. That was a clear signal not to be short.
The next stage is called a "Short squeeze", the open interest is high as price action confirms the neckline support. As long as it holds the shorts sellers will be forced to close or increase the leverage on open short contracts.
12hr
ノート
A delicious example of why maximum pain for many market participants is about to occur. A great many number of ideas remain focused on the Head & Shoulders pattern. However it is not confirming, why not?On the 5hr chart below Flag 2 has confirmed a breakout. The extension is 11% measured move to $77k. A clear 2-3k past the tens of millions currently held in short interest contracts.
The Elliot wave structure is very clear to see here.
Should the 77k area print before the month end.. that’s another story for elsewhere. It will be a significant signal.
Ww
5hr chart
免責事項
この情報および投稿は、TradingViewが提供または推奨する金融、投資、トレード、その他のアドバイスや推奨を意図するものではなく、それらを構成するものでもありません。詳細は利用規約をご覧ください。
免責事項
この情報および投稿は、TradingViewが提供または推奨する金融、投資、トレード、その他のアドバイスや推奨を意図するものではなく、それらを構成するものでもありません。詳細は利用規約をご覧ください。