Bitcoin 1H Chart Analysis
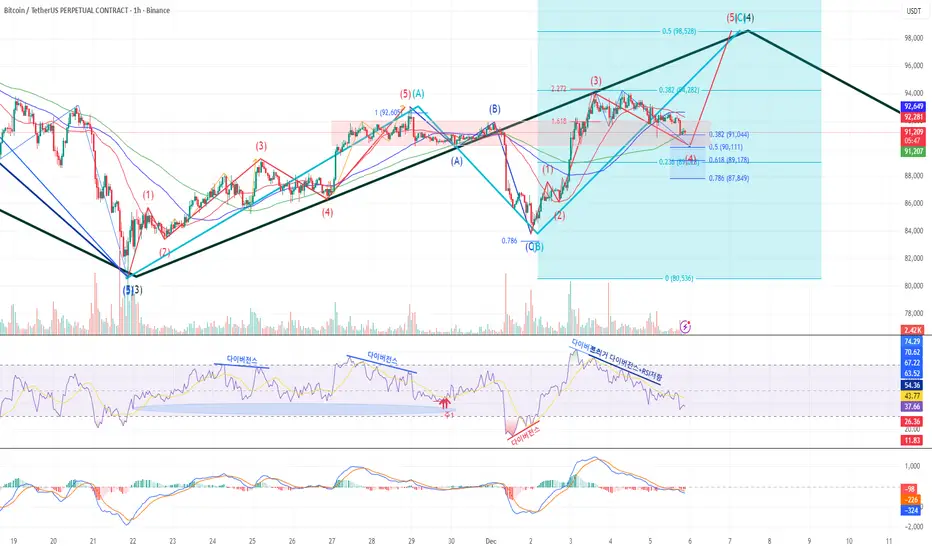
Currently tracking a light blue ABC correction within the larger Wave ④.
Wave C is unfolding as a 5-wave structure; currently in Wave ④.
Adjusted the wave count this morning: what was initially labeled as Wave ① is now considered Wave ③, due to its extended size.
Wave ③ appears to have completed near the 2.272 Fibonacci extension.
A divergence formed, leading to the current Wave ④ pullback, which is finding support at a key supply-demand zone.
Watch for a MACD oscillator crossover — this could signal the start of Wave ⑤.
Focus on reactions at the support zone for trade decisions.
'규칙' & '패턴' 그리고 '조합'
blog.naver.com/lightvblue
blog.naver.com/lightvblue
免責事項
この情報および投稿は、TradingViewが提供または推奨する金融、投資、トレード、その他のアドバイスや推奨を意図するものではなく、それらを構成するものでもありません。詳細は利用規約をご覧ください。
'규칙' & '패턴' 그리고 '조합'
blog.naver.com/lightvblue
blog.naver.com/lightvblue
免責事項
この情報および投稿は、TradingViewが提供または推奨する金融、投資、トレード、その他のアドバイスや推奨を意図するものではなく、それらを構成するものでもありません。詳細は利用規約をご覧ください。