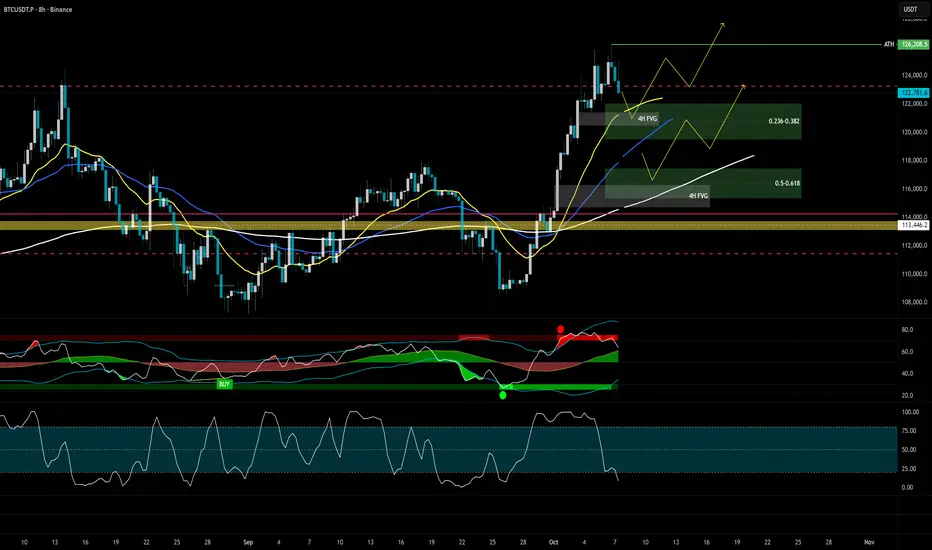
BTC 8H chart - bullish fibonacci pullback zones for resersal

I have high probability two scenarios in mind approx. 4-8% pullback.
Notice lower oscillator indicator, Stoch RSI on 8H already starting to build momentum at the bottom zone.
Might take couple of days to consolidate in those levels.
Crypto grandpa sharing charts & setups. Free TA, zero fluff.
Not financial advice — still two feet above ground.
Follow me here and on Twitter X. Thanks!
Not financial advice — still two feet above ground.
Follow me here and on Twitter X. Thanks!
免責事項
これらの情報および投稿は、TradingViewが提供または保証する金融、投資、取引、またはその他の種類のアドバイスや推奨を意図したものではなく、またそのようなものでもありません。詳しくは利用規約をご覧ください。