PVC Indicator – Sideways Market, Weak Bullish Volume & Liquidity Sweeps at Range High
📌 Market Context (BTCUSDT – 15m)
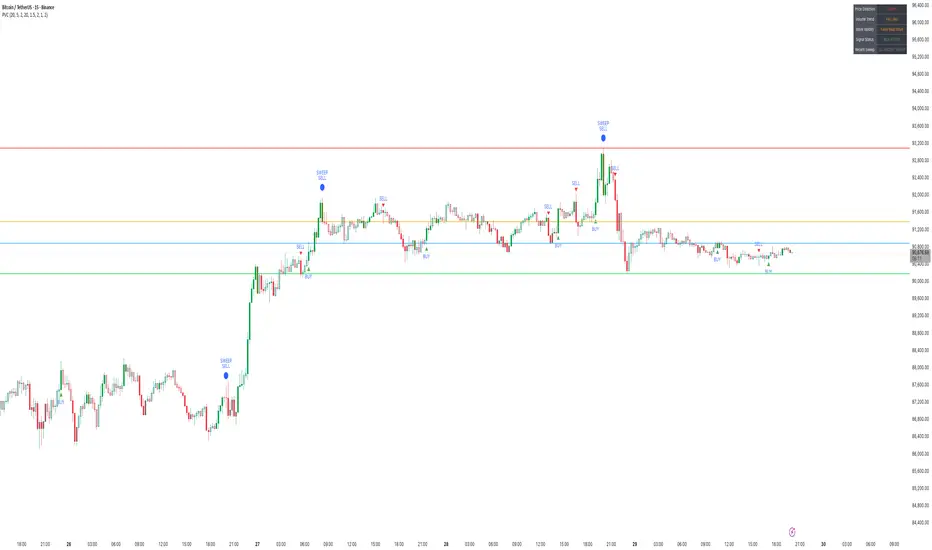
Bitcoin continues to trade in a well-defined sideways range, with price oscillating between the previous day’s High, Low, Close, and VWAP levels.
What stands out is that most short-term moves — especially bullish attempts — lack meaningful volume confirmation. On the PVC indicator, this shows up as gray candles, which indicate no correlation between price direction and volume participation.
This lack of price-volume alignment is typical of a range-bound market, where price fluctuates but institutional participation remains muted.
⸻
1️⃣ Multi-Day OHLC Levels Acting as Strong Support & Resistance
The Multi-Day OHLC module plotted on the chart is playing a major role in revealing why the market has been stuck in a range:
• Previous Day High (PDH) → Strong Resistance
Price repeatedly tapped and rejected from PDH, showing liquidity hunts and seller absorption, especially during the large top-side sweep.
• Previous Day Low (PDL) → Reliable Support
The market bounced multiple times from the PDL region, confirming buyers defending the lower boundary of this range — but without strong volume, which prevents any sustained rally.
• Previous Day Close & VWAP → Mid-Range Magnet
These acted as mean reversion points:
• Price frequently returned to Daily Close/VWAP
• PVC candles stayed gray
• No volume expansion occurred
This behavior confirms that the market is rotating inside a fair value zone, not trending.
Conclusion from OHLC Levels:
The repeated interaction with these levels — without breakout volume — indicates classic sideways behavior, where price respects previous day key levels and rotates between them without a directional follow-through.
⸻
2️⃣ Liquidity Sweep at the Top – Clear Stop-Hunt & Reversal
A clean bearish liquidity sweep formed at the top of the range:
• Price spiked above PDH
• Collected stop-losses
• Closed back inside the range
• PVC turned red with strong volume alignment
This confirms the sweep was real, and sellers stepped in exactly at a major resistance level.
⸻
3️⃣ Weak Bullish Volume → No Momentum Follow-Through
Across the last 24 hours:
• Very few green PVC candles (True Bull Moves)
• Majority of candles remain neutral/gray
• BUY signals trigger but lack follow-through because volume does not expand
This indicates no aggressive demand — price moves up occasionally, but without participation.
⸻
4️⃣ Bearish Moves Have Volume Support
Interestingly, PVC shows:
• Red candles where volume rises during declines
• SELL signals aligning with volume spikes
• Bearish sweeps occurring at key resistance
This means sellers are more active than buyers, even though the overall structure is sideways.
⸻
🎯 Summary
• Market: Sideways / Range-bound
• OHLC Behavior: Daily High–Low–Close acting as clean support & resistance
• Top Sweep: Strong rejection from PDH with volume confirmation
• Volume Trend: Weak on bullish moves, stronger on declines
• PVC Reading: Mostly gray → no real correlation → low conviction environment
• Bias: Neutral to slightly bearish until PVC prints green confirmation (Price Up + Volume Up)
PVC helps to clearly distinguish between fake rotations and true momentum, while the OHLC levels provide a structural map of where liquidity sits.
This analysis is for educational and informational purposes only. Not financial advice.
📌 Market Context (BTCUSDT – 15m)
Bitcoin continues to trade in a well-defined sideways range, with price oscillating between the previous day’s High, Low, Close, and VWAP levels.
What stands out is that most short-term moves — especially bullish attempts — lack meaningful volume confirmation. On the PVC indicator, this shows up as gray candles, which indicate no correlation between price direction and volume participation.
This lack of price-volume alignment is typical of a range-bound market, where price fluctuates but institutional participation remains muted.
⸻
1️⃣ Multi-Day OHLC Levels Acting as Strong Support & Resistance
The Multi-Day OHLC module plotted on the chart is playing a major role in revealing why the market has been stuck in a range:
• Previous Day High (PDH) → Strong Resistance
Price repeatedly tapped and rejected from PDH, showing liquidity hunts and seller absorption, especially during the large top-side sweep.
• Previous Day Low (PDL) → Reliable Support
The market bounced multiple times from the PDL region, confirming buyers defending the lower boundary of this range — but without strong volume, which prevents any sustained rally.
• Previous Day Close & VWAP → Mid-Range Magnet
These acted as mean reversion points:
• Price frequently returned to Daily Close/VWAP
• PVC candles stayed gray
• No volume expansion occurred
This behavior confirms that the market is rotating inside a fair value zone, not trending.
Conclusion from OHLC Levels:
The repeated interaction with these levels — without breakout volume — indicates classic sideways behavior, where price respects previous day key levels and rotates between them without a directional follow-through.
⸻
2️⃣ Liquidity Sweep at the Top – Clear Stop-Hunt & Reversal
A clean bearish liquidity sweep formed at the top of the range:
• Price spiked above PDH
• Collected stop-losses
• Closed back inside the range
• PVC turned red with strong volume alignment
This confirms the sweep was real, and sellers stepped in exactly at a major resistance level.
⸻
3️⃣ Weak Bullish Volume → No Momentum Follow-Through
Across the last 24 hours:
• Very few green PVC candles (True Bull Moves)
• Majority of candles remain neutral/gray
• BUY signals trigger but lack follow-through because volume does not expand
This indicates no aggressive demand — price moves up occasionally, but without participation.
⸻
4️⃣ Bearish Moves Have Volume Support
Interestingly, PVC shows:
• Red candles where volume rises during declines
• SELL signals aligning with volume spikes
• Bearish sweeps occurring at key resistance
This means sellers are more active than buyers, even though the overall structure is sideways.
⸻
🎯 Summary
• Market: Sideways / Range-bound
• OHLC Behavior: Daily High–Low–Close acting as clean support & resistance
• Top Sweep: Strong rejection from PDH with volume confirmation
• Volume Trend: Weak on bullish moves, stronger on declines
• PVC Reading: Mostly gray → no real correlation → low conviction environment
• Bias: Neutral to slightly bearish until PVC prints green confirmation (Price Up + Volume Up)
PVC helps to clearly distinguish between fake rotations and true momentum, while the OHLC levels provide a structural map of where liquidity sits.
This analysis is for educational and informational purposes only. Not financial advice.
Thanks.
TradeTech Analysis
Telegram Channel - t.me/Tradetech2024
Youtube Channel - youtube.com/@TradeTechAnalysis
Website - tradetechanalysis.com/
Super Profile - superprofile.bio/tradetechanalysis
TradeTech Analysis
Telegram Channel - t.me/Tradetech2024
Youtube Channel - youtube.com/@TradeTechAnalysis
Website - tradetechanalysis.com/
Super Profile - superprofile.bio/tradetechanalysis
関連の投稿
免責事項
この情報および投稿は、TradingViewが提供または推奨する金融、投資、トレード、その他のアドバイスや推奨を意図するものではなく、それらを構成するものでもありません。詳細は利用規約をご覧ください。