Bitcoin ( BTC ) price trades below $109,000 at the time of writing on Friday after slipping nearly 5% so far this week
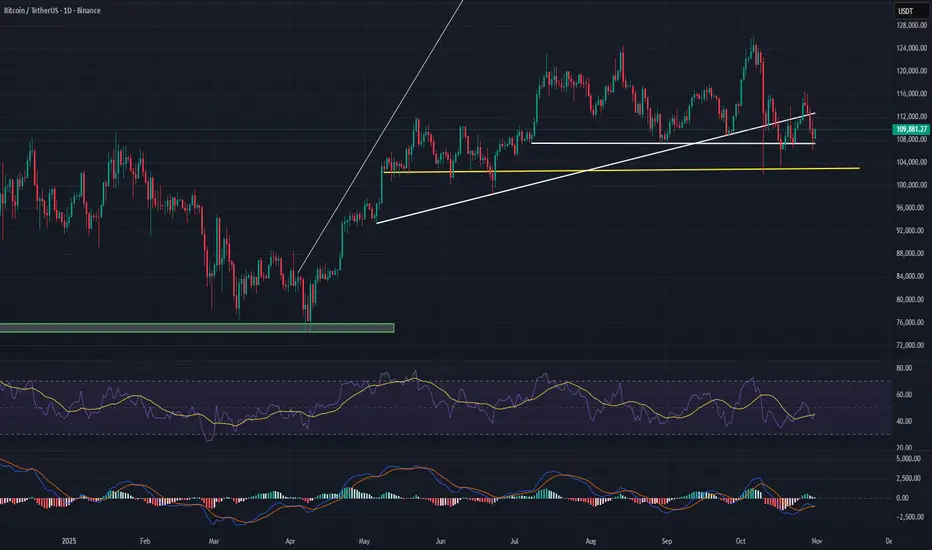
BTC price was rejected from the Trend line (drawn from the April 7 low of $74,508 to the October 6 all-time high of $126,199) at $115,137 on Monday, and declined 5.44% by Thursday. At the time of writing on Friday, BTC hovers at around $110,000.
If BTC continues its correction and closes below $106,453, it could extend the decline toward the October 10 low of $102,000.
The Relative Strength Index (RSI) on the daily chart reads 45, below the neutral level of 50, indicating bearish momentum gaining traction. The Moving Average Convergence Divergence (MACD) lines are also converging, with decreasing green histogram bars signaling fading bullish momentum.
However, if BTC finds support around $106,453, it could extend the recovery toward the $112,872.
免責事項
これらの情報および投稿は、TradingViewが提供または保証する金融、投資、取引、またはその他の種類のアドバイスや推奨を意図したものではなく、またそのようなものでもありません。詳しくは利用規約をご覧ください。
免責事項
これらの情報および投稿は、TradingViewが提供または保証する金融、投資、取引、またはその他の種類のアドバイスや推奨を意図したものではなく、またそのようなものでもありません。詳しくは利用規約をご覧ください。